
You Shall Not Pass
Ranking elite shot-stoppers with xGOT—plus the World Cup & Euro champions who quietly sit among the worst.

Hi friend,
Welcome to The Python Football Review #008!

Last week we crowned football’s greatest finishers. Today we turn the spotlight on goalkeepers and ask:
Who are the elite shot-stoppers?
To find out, I’ll dive into Opta’s post-shot data and examine:
whether the clean-sheet leaders are truly world-class shot-stoppers
which names quietly top the Goals Prevented leaderboard
which fan favourites leak more than they should (brace yourself, we’ve got a World Cup and Euro champions in the list)
A step-by-step Python template is included so you can rerun (and roast) my numbers.
Enjoy!
Quick refresher / disclaimer
If xGOT (expected goals on target) is new to you, start with my 101 primer here. In one sentence:
xGOT = the probability that a shot on target becomes a goal—ball flight, pace, and placement included.
From there we can build two related keeper metrics:
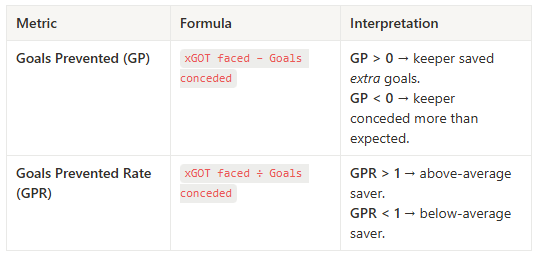
Example
A keeper faces 105 xGOT and concedes 100 goals.
GPR = 105 ÷ 100 = 1.05 → he saved 5 % more than the average goalie would.
GP = 105 − 100 = +5 → over the sample he prevented five goals than the average keeper would.
Of course, shot-stopping is only one pillar of goalkeeping. Distribution, aerial command, and sweeping all matter too—ranking low here doesn’t automatically make anyone a poor keeper, just one who saves fewer shots than the model predicts.
Thank you, Captain Obvios.
Enough talk; let’s see the data.
1 — Scope of the study
For this review we pull eight seasons of Opta post-shot data via Fbref (2017/18 – 2024/25) from Europe’s big-five leagues—Premier League, La Liga, Serie A, Bundesliga, and Ligue 1.
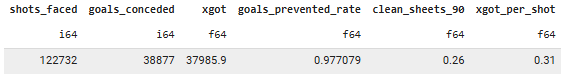
Across the sample we see:
122,732 shots on target that yielded 38,877 goals (excluding own goals)
Those shots carried 37,986 xGOT, so sample-wide Goals Prevented Rate of 0.98—keepers prevented about 2**% less** than the model expected.
The average shot on target weighed in at 0.31 xGOT, and goalkeepers logged roughly 0.26 clean sheets per 90 minutes.
In plain English: over eight seasons the “typical” big-five keeper is a hair below par—about two extra goals allowed every hundred matches. That gives us a baseline: anyone posting a positive GPR comfortably above 1.00 is bending probability in their team’s favour.
Let’s find out who.
2 — Are clean-sheet leaders world-class shot-stoppers, too?
Okay, over the eight seasons studied, here are the top 10 keepers (minimum 160 games) ranked by clean sheets per 90 minutes.
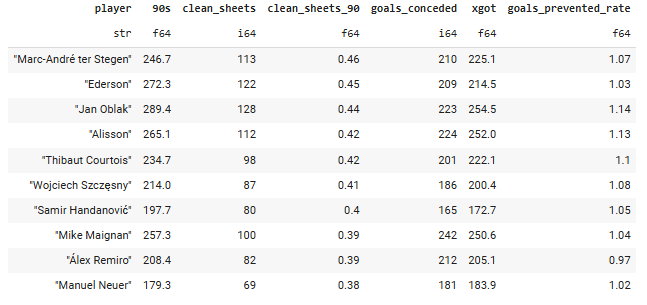
No surprises here—we see the usual suspects: first-choice keepers at elite clubs.
Across the period, Marc-André ter Stegen tops the list with 113 clean sheets in 247 full matches, or 0.46 clean sheets per 90. He conceded 210 goals from 225 xGOT, giving him a Goals Prevented ratio of 1.07. In plain English, he allowed roughly 7 % fewer goals than the average keeper would have from the same shots—fine margins.
Ederson and Jan Oblak sit second and third at 0.45 and 0.44 clean sheets per 90, while Alisson and Courtois round out the top five. If I’d closed my eyes and guessed, these five names would still have made the cut (though perhaps in a different order).
What really stands out is Oblak’s Goals Prevented ratio of 1.14: his shot-stopping erased roughly 14 % of the goals an average keeper would have conceded. That’s truly elite—though you hardly needed the stat to remember how dominant he’s been. Alisson isn’t far behind at 1.13.
Then come the interesting cases: Ederson at 1.03 and Neuer at 1.02. Both are still above par, yet only marginally so.
Does that make two world-class keepers merely average shot-stoppers?
Rhetorical question—over long samples goals and xGOT tend to converge. More likely, their strengths lie elsewhere: Ederson’s distribution powers Manchester City’s build-up, and Neuer practically invented the modern sweeper-keeper role.
Another working hypothesis — playing behind dominant sides means they face fewer truly testing shots, giving them fewer opportunities to accumulate xGOT (as is also the case for Alisson and Courtois though, so the jury is still out on this one).
The point stands, though: Goals Prevented reframes the conversation by isolating pure shot-stopping, stripping out the protection provided by an elite defence.
So what happens if we flip the question and rank keepers solely by Goals Prevented Rate? Can anyone top Oblak’s +14 %?
3 — Elite shot-stoppers
Over the eight-season window, 29 goalkeepers posted a Goals Prevented Rate above 1.0. Here are the top performers:
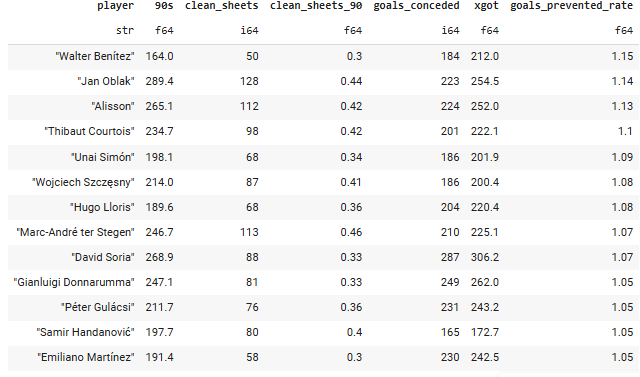
Surprise, surprise: former Nice and PSV guardian Walter Benítez tops the table with an eye-catching 1.15 Goals Prevented Rate. Put differently, he kept out 15 extra goals for every 100 he conceded—across 164 matches. Wow.
Unless you’re a Football Manager addict, this might be the first time you’ve heard his name. Benítez has just moved to Crystal Palace on a free; if he beats Dean Henderson to the No. 1 shirt, he could be a savvy FPL pick.
The metric highlights elite shot-stoppers who don’t enjoy elite defences. Because Benítez faced far more shots than keepers at super-clubs, his clean-sheet rate is a modest 0.30 per 90—still above average, but nothing to headline.
Goals Prevented cuts through that noise.
Rounding out the list are the familiar faces: Oblak (1.14), Alisson (1.13) and Courtois (1.10). Benítez has roughly 100 fewer games than this trio, so a little regression is possible in the future, but topping the chart at all is impressive.
Why it matters?
Scouts can use Goals Prevented to scan global databases for keepers at mid-table sides who are already “adding” goals—spotting the next Oblak (or dare I say Benitez) before everyone else.
Okay, now to the biggest under-performers.
4 — Elite under-performers
Twenty-six goalkeepers in the data set posted a Goals Prevented rate below 1.0. Here are the biggest under-performers:
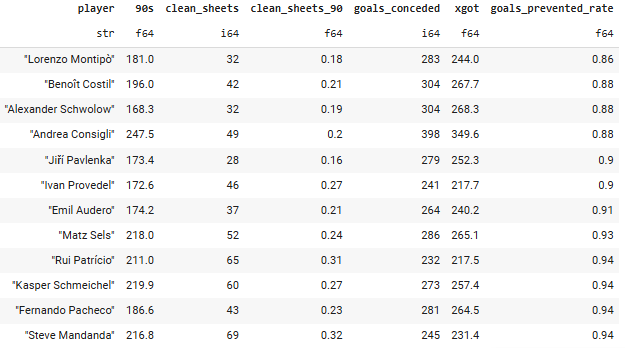
Lorenzo Montipò (Verona) anchors the table at 0.86, meaning that for every 100 goals he conceded, the average keeper would have conceded only 86. In other words, he handed opponents 14 “free” goals per 100 allowed. Ouch.
Next come journeyman Frenchman Benoît Costil, Union Berlin’s Alexander Schwolow and Sassuolo’s Andrea Consigli all with 0.88.
So far, so ordinary—until you scroll and spot World-Cup winner Steve Mandanda and European-championship hero Rui Patrício, both at 0.94.
You might argue that Mandanda was rarely France’s first-choice and that both keepers are deep into their thirties, so age drag is real. You could also shrug and say “four percentage points off the mean—maybe it’s noise.”
Still, you certaintly didn’t expect national-team players from heavyweight nations to flirt with this list, did you?
I certaintly didn't.
And finally, let’s fast-forward to 2024/25 for a fresh snapshot.
5 — What happened last year?
During the 2024/25 season, 49 goalkeepers logged at least 20 league appearances and finished with a Goals Prevented ratio above 1.0. The chart above shows the top ten.
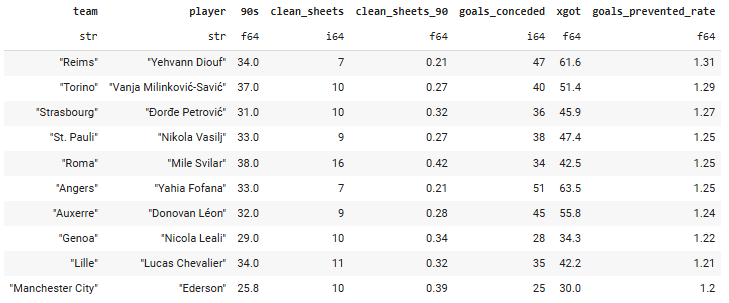
Yehvann Diouf (Reims) sets the pace at 1.31—Opta’s model says an average keeper would have conceded 31 % more goals from the same shots. Put differently, Diouf erased roughly one goal out of every three the model expected. That’s a hefty spike in form.
Next comes a distinctly Balkan quartet — three Serbs and one Bosnian — Vanja Milinković-Savić (1.29), Đorđe Petrović (1.27), Nikola Vasilj (1.25), and Mile Svilar (1.25).
If Yugoslavia still existed, its national-team coach would have a pleasant selection headache. Well, I guess Serbia’s coach certainly does now.
At the other end of the table, 31 keepers fell below the break-even line. The headline shock sits in the bottom ten: PSG’s undisputed No. 1 Gianluigi Donnarumma slumped to 0.87.
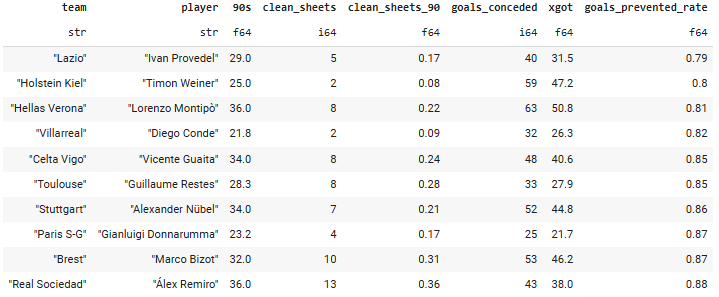
Wait, what?
Despite starring in PSG’s late-stage Champions League run, Donnarumma cost his side roughly 13 % more goals than xGOT predicted over the league season. Maybe supporters forgive that as long as he delivers on the nights that truly matter, but the domestic data is hard to ignore.
And finally, below you’ll find a Python template to reproduce every step of the analysis from scratch.
6 — The Python Corner
Here’s how to replicate everything we just did in Python.
Are you new to Python and programming? Head to Google Colab and open a Python session— all you need is a Gmail account.
Next, grab the notebook I used for this issue by clicking the button below. Inside, you’ll find step-by-step instructions on how to
pull eight seasons of Opta data from FBref with
soccerdata;wrangle it with
polars; andreproduce every insight we’ve just covered.
Once downloaded, simply import the notebook, launch the code and enjoy.
And there you have it—elite shot-stoppers in a nutshell.
If this issue helped you, please pass it along!
You now know how to rank elite shot-stoppers with xGOT, quantify how much they save their teams, identify the biggest under-achievers, and pull eight seasons of data with Python to analyse all of it yourself.
Until next week,
Martin
The Python Football Review
Great article. Rare to see such detailed analysis on goalkeepers. A couple of reflections from my side: first one is Matz Sels, quick look at FBref shows a PSxG-GA of +8% and clean sheet percentage of 34 %, suggesting that he overperformed quite a lot in 24/25 season compared to his average level from previous years? Donnarumma is another interesting case, as I remember him being benched halfway through the season - but once he got back in the starting 11, his been unstoppable (purely based on the eye haha). Would be interesting to see his stats before and after here. What do you think?