
Shooting Royalty
Ranking elite ball-strikers with xGOT: how much they outshoot the average finisher and which big names fall short

Hi friend,
Welcome to The Python Football Review #007!

Last week we busted the myth of the clinical striker—why even superstars rarely beat their xG by much, and why that’s perfectly fine. The big lesson: only a few players finish well above expectation, and the word “clinical” is messy because xG mixes team service, movement, and finishing into one number.
To study pure finishing we need a sharper tool: xGOT (Expected Goals on Target). xGOT looks at what happens after the ball leaves the boot, so it isolates a striker’s shot placement.
So, in this issue we’ll:
reveal who the best strikers of the ball are,
see how far they outshine the average shooter,
call out the big names who ‘under-perform’ xGOT yet still top the scoring charts (spoiler: two Ballon d’Or winners make the list),
and give you the full step-by-step Python code to run the analysis yourself.
Enjoy!
Before we dive in, a quick refresher / disclaimer
If xG or xGOT are new concepts for you, you can grab a primer here and here. In short:
xG (Expected Goals) gauges chance quality—how promising the opportunity was before the shot.
xGOT (Expected Goals on Target) gauges shot execution—what the striker actually did with the ball after contact.
To isolate pure finishing skill professionals compare xGOT to xG:
Over-performing xG → the player beats the “average” shooter on identical chances.
Under-performing xG → could signal below-par finishing or contextual factors we’ll unpack later.
So, for this issue we’ll treat xGOT strictly as a proxy for striking technique. It goes without saying that an elite forward offers far more than goals—target men and pressing forwards change games without scoring—but today we’re zooming in on finishing alone.
Alright, let’s roll out the data.
1 — Scope of the study
For this review we’ll pull Opta’s xGOT dataset—Opta calls it Post-Shot Expected Goals (PSxG)—via FBref. It covers eight seasons of shot-level data from Europe’s top-five leagues (2017/18 – 2024/25) and totals 360,430 shots.
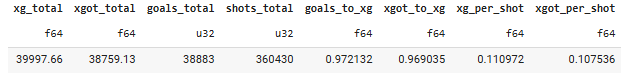
Across those attemps, 5,724 players accumulated a total of 38,883 goals from 39,998 xG and 38,759 xGOT. This means that the:
Goals : xG = 0.97
Players scored about 3 % fewer goals than the pre-shot model predicted. That near-one ratio is the sanity check we want: over a huge sample, hot and cold streaks cancel out, so xG should line up with reality. The small shortfall suggests that, overall, goalkeepers and imperfect finishing trimmed the total slightly. Or perhaps it’s simply a bit of noise — right in the range where statistical error tends to lie.
xGOT : xG = 0.97
Post-shot expected goals are at the same 0.97 ratio. Even after accounting for shot placement, the picture barely changes: strikers are still expected to finish just below the pre-shot expectation. This should not surprise you. If xGOT had drifted far from xG, we’d worry about model noise — because over the long term, the two should converge.
xG / shot ≈ xGOT / shot ≈ 0.11
The typical open-play attempt in the big five leagues offers roughly an 11 % chance of becoming a goal, whether judged before the strike (xG) or after you know its placement (xGOT).
These results echo last week’s findings: over large samples, goals converge toward xG, and the average non-penalty shot in the big five leagues sits around 0.11 expected goals. Numbers differ slightly from last week because that issue used Understat data over an 11-season window.
With the baseline set, let’s see which players top the charts in xGOT ÷ xG.
2 — The best strikers of the ball
Over the 8 seasons studied, 38 players reached 80+ league goals. Exactly 20 finished with an xGOT : xG ratio above 1.00—meaning their shot placement added value on top of chance quality. The stand-outs:
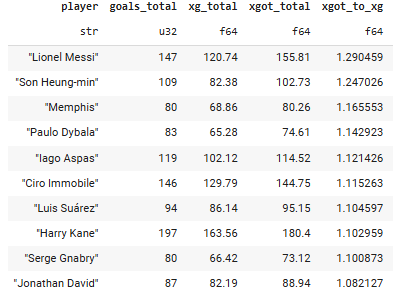
Messi tops yet another finishing table. His shot-placement-to-chance ratio is 1.29, meaning his finishing adds 29 % to the conversion probability of every shot compared with the average player in the same positions. World-class—as if you needed reminding.
Close behind is Heung-min Son at 1.25 (+25 %). Yes, Spurs really did have a world-class finisher—and that isn’t even Harry Kane. (Though Kane still makes the list at No. 8 with +10 %.)
After those two, the gap widens:
Memphis Depay closes out the top three at +17 %—proof that a Premier-League-only lens can miss La Liga/Ligue 1 excellence (I mean he did flop at United).
Paulo Dybala (+14%), Iago Aspas (+12%), and Ciro Immobile (+12%) complete the top six. I knew Immobile was banging in goals in Serie A, but come on — ranking him (and Aspas, another Premier League flop) among the most efficient shooters? I wouldn’t have guessed that.
Only then do we see the usual suspects: Luis Suárez and Harry Kane (both +10 %).
Serge Gnabry also posts +10 %, while Jonathan David from Lille adds +8 %. (Sneaky good—how hadn’t I noticed him sooner?)
Value added per shot
Another way to look at this is through the value added per shot. The table below presents the average xGOT per shot, the average xG per shot, and the absolute difference between the two.
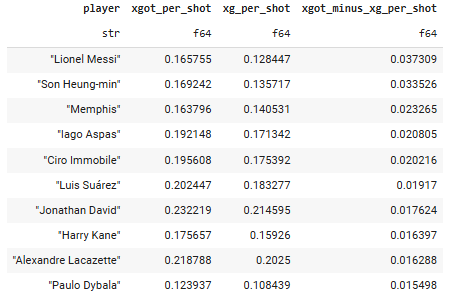
Looking at xGOT − xG per shot highlights who squeezes the most extra value out of each and every attempt.
Messi’s average chance is already 13%, but his placement bumps it up to 17% — a 4-point boost per shot. Put differently, the best shooter in the world adds just 4 percentage points per attempt. Talk about fine margins. Of course, once you add up multiple shots, the difference becomes more noticeable.
Son adds 3 points; Memphis, Aspas, and Immobile sit around 2.
Okay, so now that we’ve covered the best shooters, let’s take a look at the underperformers.
3 — The ‘underperformers’
At the opposite end of the spectrum, 18 of the 38 high-volume scorers posted an xGOT-to-xG ratio below 1.00.
The ten lowest (who still scored more than 80 goals) appear in the table below.
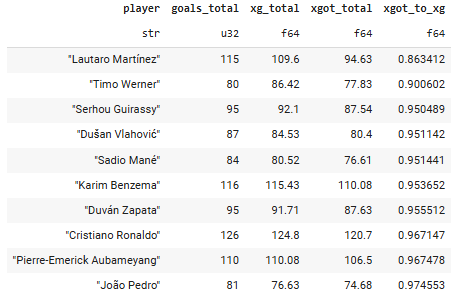
Lautaro Martínez tops the list with an xGOT:xG ratio of 0.86. In other words, compared with an average player shooting from the same locations, his finishing reduces the likelihood of a goal by about 14 %.
How can that be, given his reputation as one of the world’s best strikers?
First, note that Martínez still out-scores raw xG and xGOT: he has 115 goals from 110 xG (a figure that includes team supply, movement and shot volume but still). He beats his 96 xGOT (115 goals), so something beyond sheer shot placement is helping him.
Why, then, does his xGOT/xG lag? Three plausible explanations:
Shot mix. Many of his attempts may be missing the target. Off-target shots keep their full xG but add zero to xGOT, pulling the ratio down.
Goalkeeping. Even when his placement is mediocre, the goalkeepers he faces may under-perform, conceding shots that average keepers would save.
Starting quality. He shoots frequently from close range, where xG is already high. Close-range strikes leave less room to add value through pinpoint placement—unlike, say, Messi-style curlers from distance that can boost conversion probability by double digit percentage points.
A surface-level read would label Martínez “wasteful,” but context matters.
Next comes Timo Werner, whose finishing is roughly 10 % below average—no surprise given his (bad) reputation at Chelsea and Tottenham. The same trio of factors (shot mix, goalkeeping, starting shot quality) could explain his shortfall if poor ball-striking ability does not satisfy you.
Most of the remaining group cluster around 0.95, near the overall mean of 0.97.
Again, at first glance, Karim Benzema (0.95) and Cristiano Ronaldo (0.97) might look like poor finishers (purely data-wise!).
They’re not. Thank you, Captain Obvious.
They win through where and how often they shoot, not by squeezing every last drop out of each strike: execution roughly average, shot selection elite. Blend in ageing curves—our sample spans Ronaldo’s final Madrid season and his time at Juve and Man United—and any modest xGOT surplus gets diluted.
Okay so what can we make from this?
4— Implications
1. True elite ball-strikers are unicorns
Across 5,724 players who took 360,430 shots in eight seasons, only 20 high-volume scorers—about 0.3 % of the sample—consistently added value with placement.
Even the very best (Messi) raise an average chance from roughly 13 % to just 17 %. Margins are razor-thin, which is why random variance can hide—or exaggerate—a short-term “hot streak.”
2. Placement gains disappear without volume
Because the per-shot edge is tiny, a striker needs a large sample before placement skill shows up through the noise.
Most forwards take fewer than 100 shots a season, so judging finishing quality after “a couple of matches” is wishful thinking.
3. Under-performance ≠ poor finisher
Lautaro Martínez, Benzema, and Ronaldo prove that xGOT < xG can coexist with world-class goal totals.
High-frequency shooters who find better positions—or face shaky keepers—can still beat raw xG. Shot selection, movement, and team context remain decisive.
4. Convergence creates edges
Because league-wide xG and xGOT trend toward 1 over time, temporary gaps are where analysts may strike (so to speak):
Recruitment: Spot undervalued youngsters whose placement already outperforms xG, even if their volume is low?
Risk management: Flag veterans riding unsustainable hot streaks before the market prices correction in?
Now let’s see who the top xGOT/xG performers were during the 2024/25 season.
5 — Top 24/25 Finishers
One last stop before we share the Python notebook: who actually topped the xGOT ÷ xG leaderboard in Europe’s big-five leagues last season?
I filtered for players with at least 10 league goals and then ranked them by the ratio of post-shot to pre-shot expected goals.
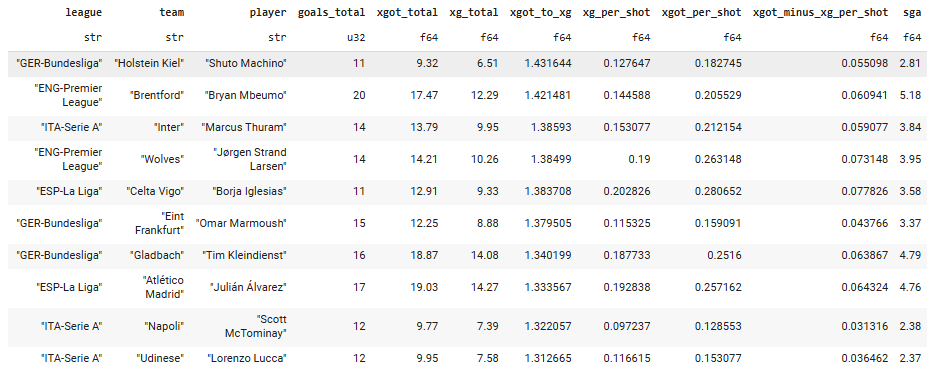
Shuto Machino comes out of nowhere (and newly promoted Holstein Kiel) to top the table with 1.43 xGOT to xG ratio. His shot-placement turned a typical 12.7 % conversion chance into roughly a 18.2 % one. Over the whole season, he added nearly 3 extra goals if we use the Shooting Goals Added (SGA) metric of xGOT − xG (the extra goals a player’s ball-striking contributed relative to an average finisher on the same shots).
Bryan Mbeumo is right behind at 1.42 xGOT to xG, with a league-best +5.2 SGA — no wonder Manchester United are googling his name.
Marcus Thuram finally gives Inter a striker who over-performs the models (sorry, Lautaro), while Strand Larsen (Wolves) validates the “one-to-watch” tag from our earlier xGOT primer.
And yes, that really is Scott McTominay sneaking into the top ten. Quite the season he’s had.
Why this matters
Across roughly one-third of Messi’s career, he adds +29 % per shot. Yet in a single season we already see ten players beating that mark. The lesson of course isn’t that Shuto Machino is a better finisher than Messi. It’s that one-year leaderboards are noisy.
Treat seasonal xGOT surpluses as flags, not verdicts, until the sample size grows.
And finally, here’s how to replicate this analysis in Python.
6 — The Python Corner
Interested in recreating the analysis? All you need is a Python session and the accompanying notebook.
If you’re brand-new to Python, the quickest on-ramp is Google Colab: open a new notebook in your browser, sign in with your Gmail account, and you’re ready to code—no local setup required.
Next, grab the notebook I used for this issue by clicking the button below. Inside, you’ll find step-by-step instructions on how to:
pull eight seasons of Opta data from FBref with
soccerdatawrangle it with
polarsreplicate every insight we’ve just covered
And there you have it—football’s shooting royalty, TL;DR style.
If this issue helped you, please pass it along!
You now know how to rank elite finishers with xGOT, quantify how much they out-shoot the average striker, spot the big names who fall short, and see what eight seasons of data reveal about over- and under-performance in front of goal.
Until next week,
Martin
The Python Football Review