
Expected Goals on Target (xGOT) 101
What xGOT measures, how it fixes xG’s blind spots, how analysts rely on it, and a Python shortcut to bulk-download the data

Hi friend,
Welcome to The Python Football Review #002!
We previously broke down xG (missed it? grab it here).
Today we move one step closer to goal: Expected Goals on Target (xGOT).
By the end of this issue, you’ll know:
what xGOT really measures
how it patches xG’s two biggest blind spots
the two ways analysts rely on it (and why we should talk about Strand Larsen and Emiliano Martinez more)
how to pull seasons of xGOT with just a few lines of Python (templates included)
Enjoy!
First things first… but Martin didn’t you say xG is already the best forward-looking metric we’ve got?
First, it was the data providers who said it.
And second, xG is indeed brilliant at describing chance creation, but it freezes the play before the ball leaves the boot.
xGOT presses “play” and tells us what happened after the strike.
And that small difference unlocks a lot.
1 — Why xG needed an upgrade
Even xG die-hards admit two stubborn flaws:
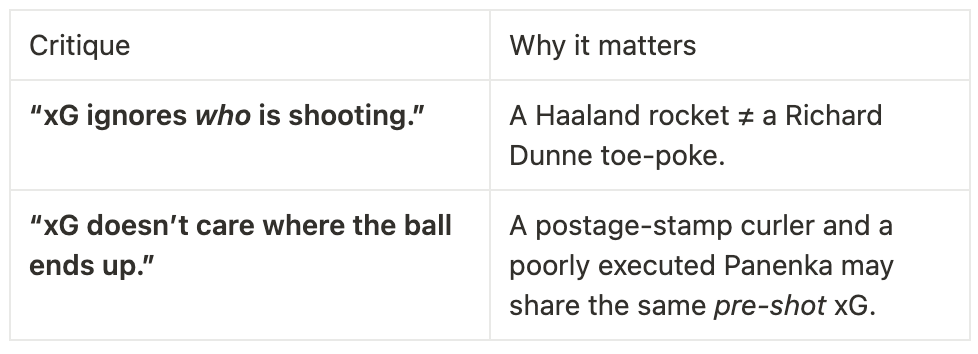
Enter xGOT.
A more skillful striker will typically post a higher xGOT—striking the ball cleaner, placing it smarter, and adding extra pace or spin. In short, xGOT bakes a slice of execution skill into the goal probability, neatly answering both critiques.
Let’s define xGOT and then explore how professionals use it.
2 — So, what is xGOT?
Expected Goals on Target looks only at on-target attempts.
It begins with the shot’s original xG, then layers on post-contact detail:
precise landing spot in the goal frame
height, velocity, even spin
A postage-stamp rocket earns more credit than a daisy-cutter straight at the keeper.
In short, xGOT answers:
“Given how this ball was struck and where it finished, how often does a keeper still save it?”
Declan Rice’s second goal vs Real Madrid — textbook example
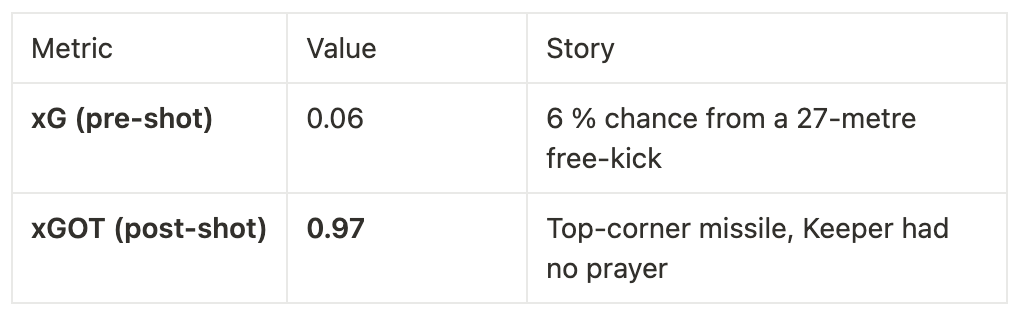
Same attempt, two very different tales: the chance was mediocre, the strike was elite.
An xGOT of 0.97 means that if a player executed that exact strike 100 times—same speed, placement, and technique—97 would find the net, and the keeper would save only three of those attempts.
Miss the target or get your shot blocked? xGOT = 0. After all, you can’t score what you don’t put on frame.
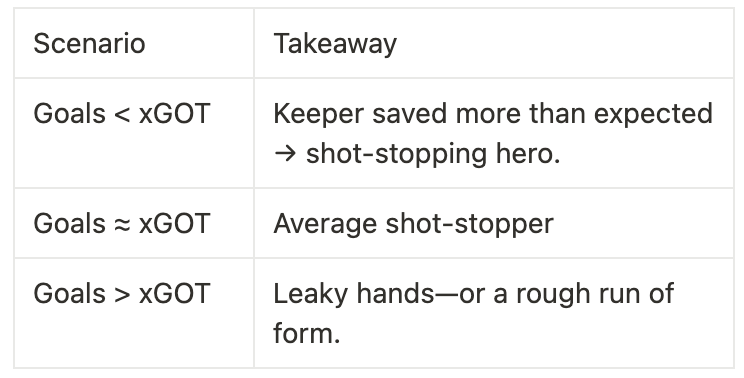
A key takeaway is that—just as with xG—over large samples xGOT and actual goals converge.
That means you can choose a time window (a month, half-season, full campaign) and measure how much a team or player over- or under-performed during that span.
(Note that depending on the data provider, xGOT may also be called post-shot expected goals (PSxG) so be prepared).
3 — Two ways professionals use xGOT
Quantifying finishing quality
Beginners often judge a striker by Goals vs. xG. That’s a start, but xG bundles two separate things:
Getting into position – the runs, passes, and off-ball movement that create the chance
Estimating the shot’s chance to become a goal – without ever measuring how the ball was struck
So Goals-minus-xG mixes chance creation and finishing outcomes, while overlooking the crucial nuance of execution (placement, power, spin).
To isolate pure finishing skill, compare xGOT to xG instead:
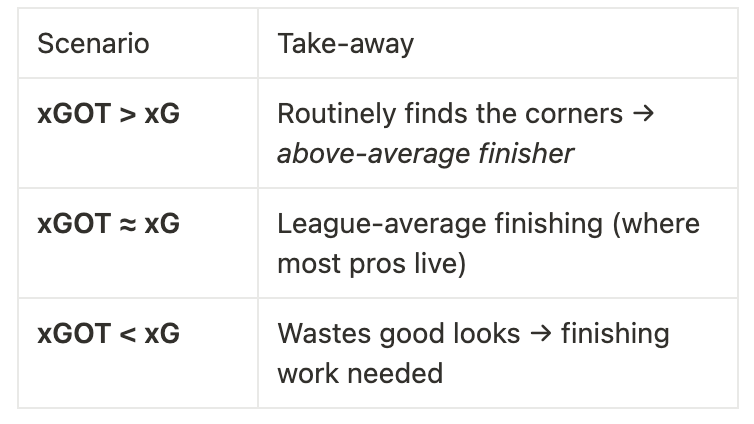
A handy summary metric you may encounter is Shooting Goals Added (SGA), which is simply SGA = xGOT − xG
High SGA? A scout’s eyebrow should rise.
Low or negative? Either poor technique or a cold streak—check the sample size before you draw conclusions.
This means that if a striker racks up 20 xGOT in a season while registering 15 xG, his Shooting Goals Added would be: 20 − 15 = +5. In other words, his finishing skill would be expected to deliver five extra goals above expectation for his team over that period.
“We need to talk more about Strand Larsen”
Okay, let’s do a mini–case study. A couple of weeks ago, BBC Sport argued we should be talking more about Strand Larsen at Wolves.
Wait, Strand who?
Let’s see what SGA = xGOT−xG reveals about that striker—even if this is the first you’ve heard of him.

As of May 2 (when I’m writing), here are the top six Premier League non-penalty goal scorers. Salah, Haaland, Isak. Nothing surprising here.
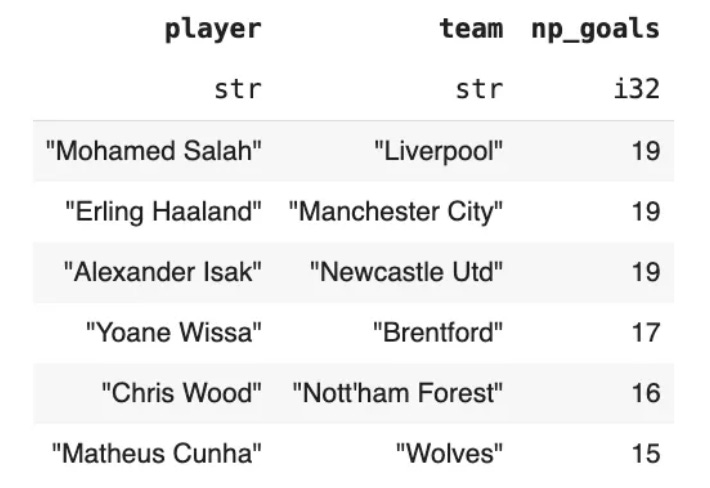
Now, here are the top six players by SGA = xGOT − xG.
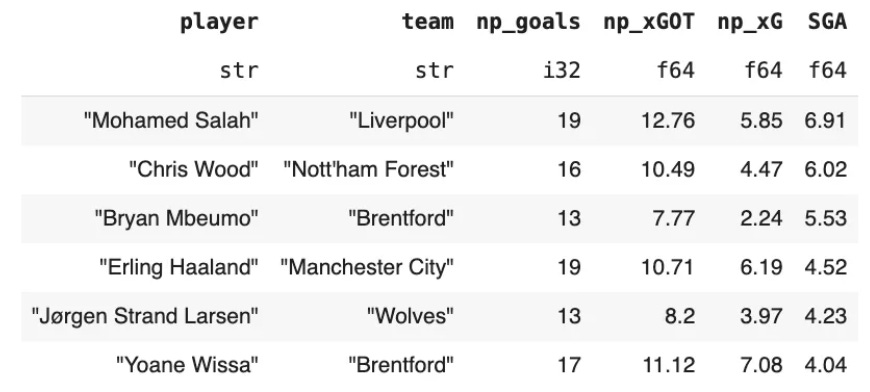
Mo Salah still leads with +6.91 SGA—he has scored nearly seven extra goals purely through his finishing skill. Next comes Chris Wood (+6.02), then Bryan Mbeumo (+5.53).
And then there’s Strand Larsen, climbing into fifth with +4.23 SGA.
SGA offers a fresh lens. For established names like Salah or Haaland, it confirms what we already suspected. But Larsen’s place in the top five shows the Wolves hype has real merit.
I’m not claiming xGOT—or SGA—is flawless. Strikers contribute more than goals alone. But when it comes to pure shot execution, it adds the nuance we’ve been missing.
Maybe it is indeed time to talk about Strand Larsen xGOT more.
Moving on…
Assessing shot-stopping
The second major use of xGOT is to assess the shot-stopping quality of goalkeepers.
The logic is straightforward:
if a keeper concedes more goals than xGOT would predict, he’s underperforming;
if he concedes fewer, he’s exceeding expectations.
So for keepers we flip the script and talk about Goals Prevented = xGOT conceded − Goals conceded
Please note an important nuance:
For strikers, we compare xGOT to xG—that is, we measure how well the striker struck the ball versus the average shot from that position.
For goalkeepers, we compare xGOT conceded to goals conceded—that is, we assess, given the difficulty of the on-target shots they faced, whether keepers saved or allowed them.
Calculation note: When comparing xGOT conceded to goals conceded, data providers typically drop own goals, since no xGOT value can be assigned to a strike that was unintended for the target.
This means that if a keeper conceded 40 goals in a season—4 of which were own goals—while facing 38 xGOT, then his Goals Prevented would be: 38 − (40−4) = +2. In other words, his shot-stopping skill saved an extra 2 goals for his team over that period.
“Emiliano Martinez is not a great goalkeeper”
Okay, let’s do another mini–case study. Emiliano Martínez often draws criticism—mainly for his outspoken personality (just remember that World Cup celebration).
Pundits routinely question his quality—”he’s a good goalkeeper, just not a great goalkeeper”. So, what does xGOT reveal?

Since 2019/20 (through May 2, as I write), Martínez has racked up +10.5 Goals Prevented (that’s 233.5 xGOT faced – 223 goals conceded as per Opta via Fbref), which works out to +0.09 Goals Prevented per 90 minutes per season. Over a 38-game season, that’s +3.42 goals saved.
How does he compare to (the great) title-winning peers?
Ederson: +4.1 Goals Prevented (165.1 xGOT – 161 goals), or +0.03 per 90 → +1.14 per 38 games
Alisson: +12.1 Goals Prevented (178.1 xGOT – 166 goals), or +0.05 per 90 → +1.90 per 38 games
Martínez’s +3.42 dwarfs Ederson’s +1.14 and edges out Alisson’s +1.90.
See why analysts rave about him now?
I’m not claiming xGOT is the sole arbiter of goalkeeping greatness—there’s distribution, command of the area, and so on—but in pure shot-stopping terms, Martínez ranks among—and arguably leads—the Premier League (over the last six seasons).
And finally here’s the easiest way to get xGOT data with Python.
4 — Getting xGOT data in Python
The easiest free route—no custom scraping, no manual copy-pasting, no pricey API key—is the soccerdata wrapper by Pieter Robberechts (@p_robberechts). In just a couple of lines, you’ll be swimming in post-shot metrics from Opta (called PSxG on FBref).
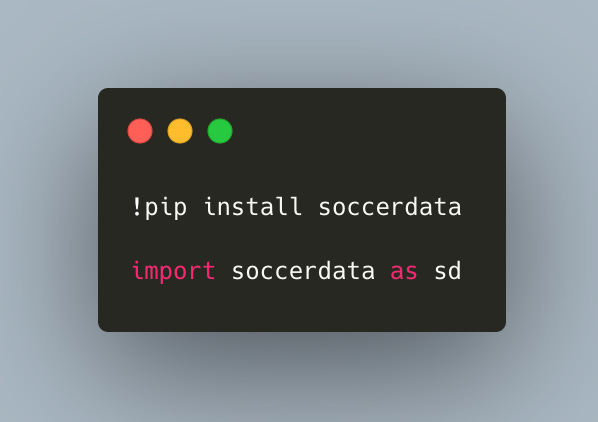
First, if you’re on Google Colab (the fastest way to start Python with zero setup), install and import soccerdata.
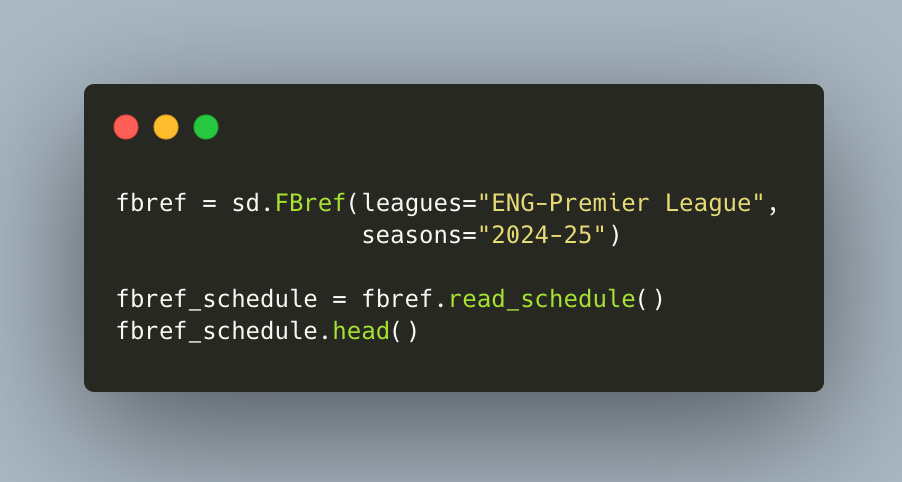
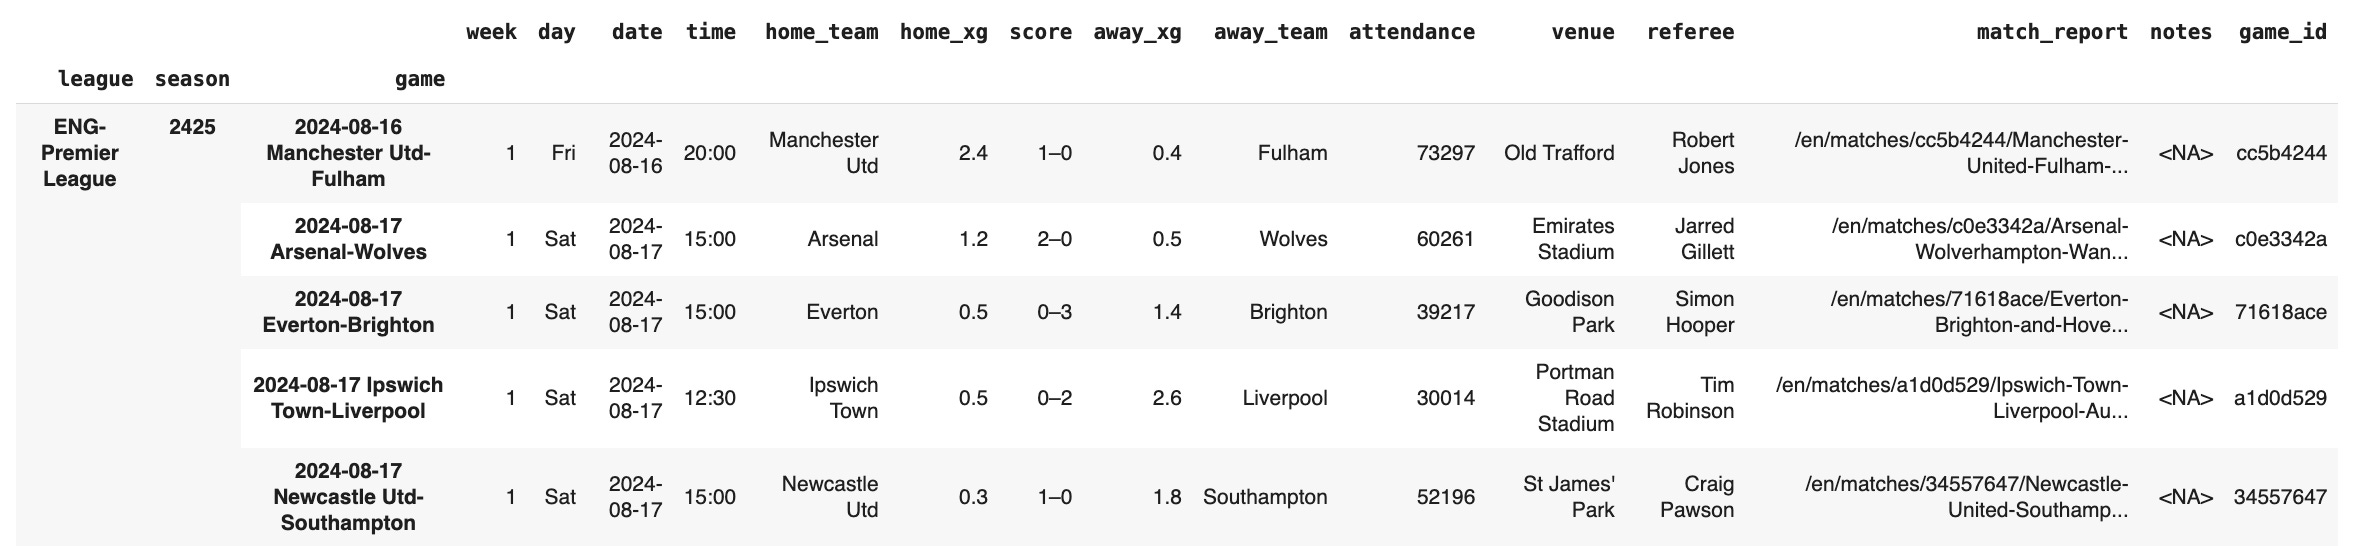
Then define your study parameters—for example, Premier League, 2024–25—and call read_schedule() to fetch that season’s fixture list.
Once you have the schedule, extract the game_id column into a list and pass it to read_shot_events().
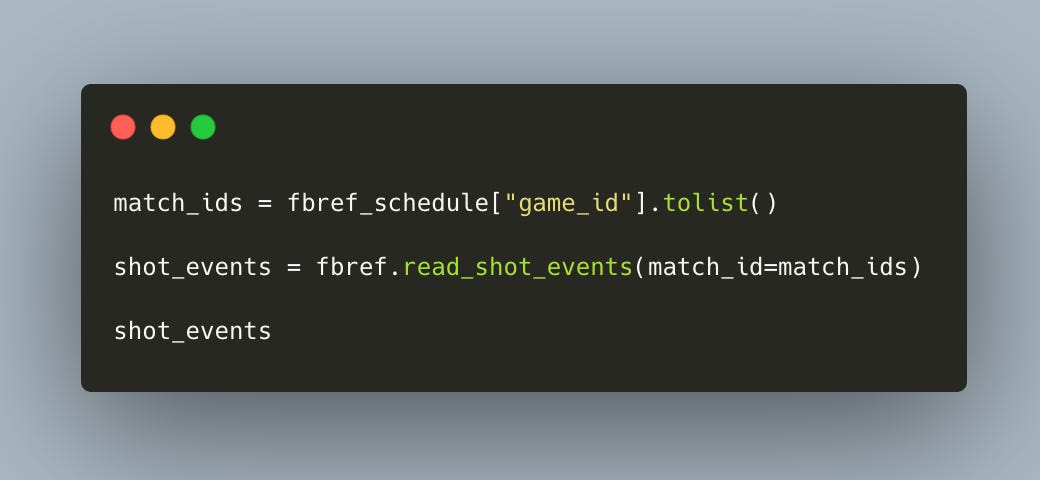
The result is a pandas DataFrame where each row is a shot event: minute, player, xG, PSxG (xGOT), outcome (goal/off-target/saved/blocked), distance, body part, plus the two players who combined to create the chance.

With eight lines of code you’ve built a detailed shot log. Note: pulling one game’s worth of shots takes about 7 seconds—so a full 380-game season is roughly 45 minutes.
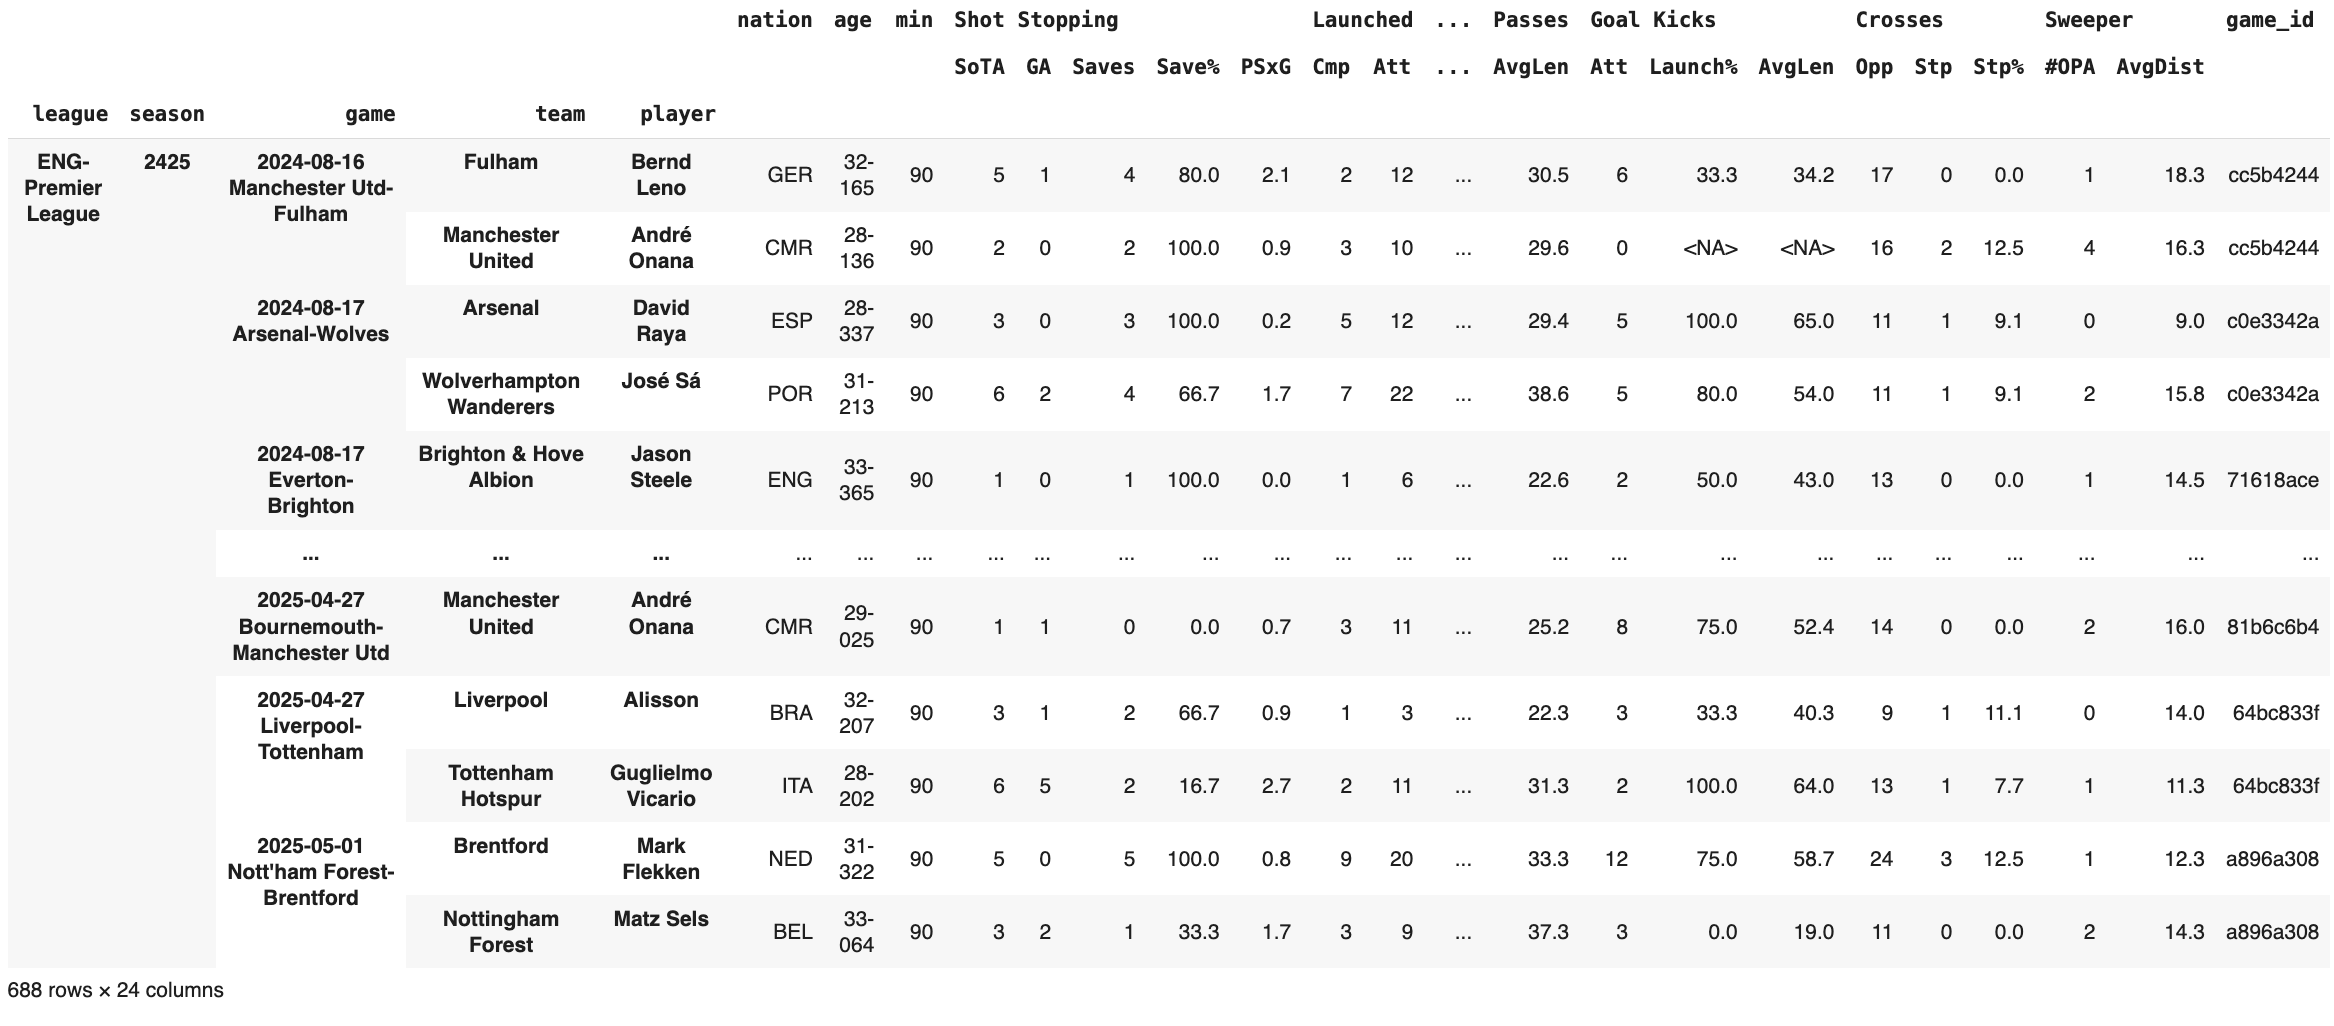
For goalkeeper analysis, run a similar call to read_player_match_stats(stat_type="keeper").
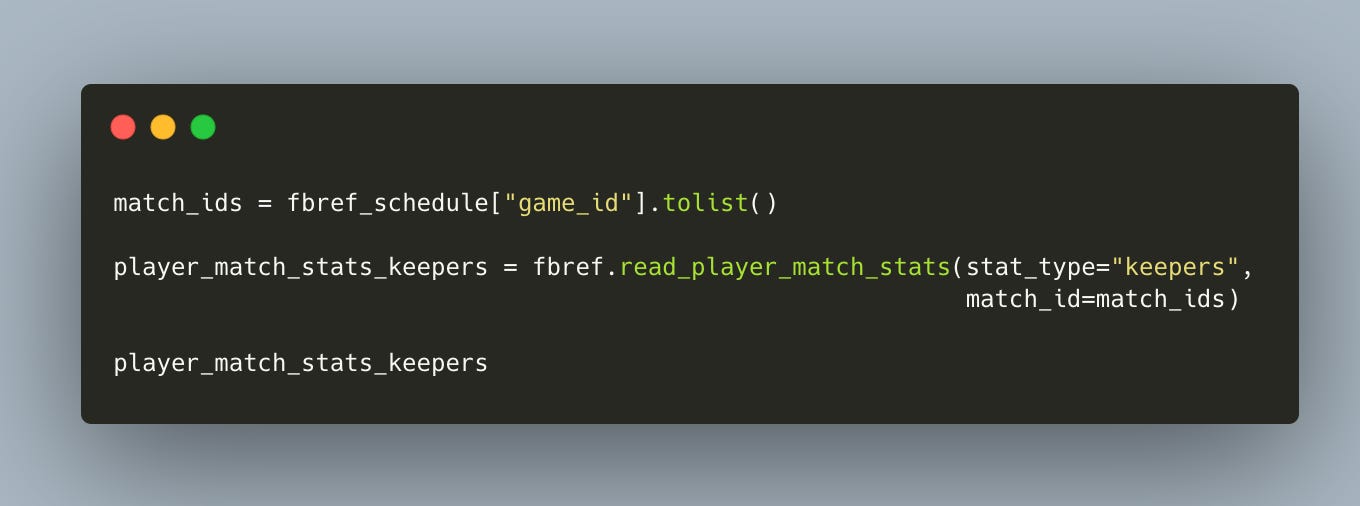
You’ll get one row per keeper per match, with fields like saves, goals conceded, PSxG (xGOT) faced, and more—ready for your shot-stopping deep dive.
I did tell you it was going to be easy, didn’t I? 😊
Here’s a link to the code if you want to copy-and-paste it.
Key takeaways
xG explains chance creation; xGOT shows what the shooter did with it.
For strikers: xGOT vs. xG → finishing talent.
For goalkeepers: xGOT conceded vs. Goals conceded → shot-stopping grade.
Boom—that’s xGOT 101.
If you found this newsletter helpful, please spread the word! You now know how xGOT is calculated, what it measures, why it matters, the two ways professional analysts use it, and how to grab xGOT data in seconds.
I’m still experimenting with the format of the newsletter, so your feedback is super welcome—would you prefer shorter content, longer deep dives, more Python, or more football concepts? Or does this format hit the mark?
My aim is to build a truly practical newsletter together with you.
Until next week,
Martin
The Python Football Review
P.S. If you enjoyed this newsletter and want to support it (I spend around 8 hours writing these), please share it on Twitter or LinkedIn. I know it can feel like a chore—trust me, I often hesitate too—so to say thanks I’ll send you an extended Python notebook that automatically pulls eight seasons of xGOT data (shots and goalkeeper metrics) from Europe’s top five leagues, fully wrangled into one analysis-ready dataset. Just send me an email (martin@pythonfootball.com) once you’ve shared, and I’ll send it over. Cheers!
Great explanations! I just have a simple question I can't wrap my head around just yet. When you say
//This means that if a striker racks up 20 xGOT in a season while registering 15 xG, his Shooting Goals Added would be: 20 − 15 = +5. In other words, his finishing skill delivered five extra goals above expectation for his team over that period.//
Shouldn't it mean that his finishing skill IS EXPECTED TO deliver 5 extra goals above expectation, BEFORE THE GK'S SHOT STOPPING ABILITY COMES INTO PLAY? Because nowhere in the equation do we have actual goals scored come into play, it reasons that actual goal also should not feature in the outcome?
Thanks for clarifying and pointing out where my fallacy may be!! :)
Great stuff again sir!