
Expected Assists (xA) 101
What xA measures, why people confuse it with xAG (and why you shouldn't), how to uncover hidden creative talent, and how to pull tons of xA data with a few lines of Python code

Hi friend,
Welcome to The Python Football Review #004!
We previously dissected Expected Assisted Goals (xAG). If you missed that issue, catch up here.
Today we explore its first cousin Expected Assists (xA)—and, spoiler alert, they are not the same metric.
By the end of this issue, you’ll know:
what xA stands for
how it patches two of xAG’s biggest blind spots
how analysts use it—and the traps you should avoid
how to profile different types of creators
how to scrape full seasons of xA with just a few lines of Python (templates included)
Enjoy!
Wait… aren’t xA and xAG the same thing?
Be honest. How many of you thought they were interchangeable? ✋
I certainly did.
Turns out I was wrong.
Both stats aim to value creativity, but under the hood they are somewhat distant relatives.
Quick refresher on xAG
xAG assigns the xG of the next shot to the passer who supplied that shot.
Blind spot #1 – The dribble tax: if the receiver slaloms past five defenders before shooting, the original passer still gets credit for the inflated xG.
Blind spot #2 – The pass‑before‑the‑pass: if the receiver decides to pass rather than shoot, the original passer receives zero credit.
xA removes both blind spots:
Freeze‑frame at reception – The passer is scored the moment the ball arrives, before any solo heroics inflate xG (looking at you, Leo Messi).
Every completed pass counts – Even if no shot follows, each pass receives a probability of becoming a goal.
But let’s not get ahead of ourselves.
1 — So What is xA?
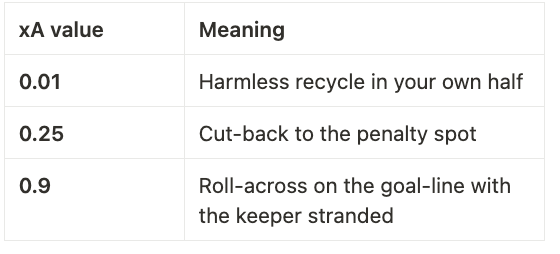
Every completed pass is graded from 0.00 to 1.00 according to how often historically similar passes became goals.
For example, a diagonal through‑ball completed inside the box might score 0.25 xA—meaning one in four similar passes historically became goals.
Miss the receiver entirely? xA = 0. You can’t assist phantom team‑mates.
Thank you, Captain Obvious.
What goes into the model?
Pass context
• Start & end coordinates
• Pass length & angle
• Delivery type (through‑ball, cross, set‑piece, header…)
• Phase of play (open play, free‑kick, corner…)
Historical outcome
• Frequency with which those passes became official assists
Most providers run a logistic regression (or gradient‑boosted tree) to spit out the probability.
Important: xA stops counting at reception. The receiver can pass backwards or dribble sideways; the passer already has his probability.
xA therefore does not tell you how many assists a player should have. Instead it measures the quality and frequency of passes into dangerous areas.
2 — The classic analyst pitfall
Because every successful pass enters the tally, high‑possession teams will naturally pile up xA. Summing an individual’s season‑long xA and comparing it one‑for‑one with his assist total is a category error:
xA ≠ “deserved assists”
xA → “volume‑weighted danger injected by passes”
Always look at per‑90 or possession‑adjusted rates and compare roles, not raw totals.
And also, be mindful of how each data provider labels its statistics.
For instance, Opta data on FBref follows the definitions we’ve used here, whereas Understat calls “xA” what we’ve previously defined as xAG.
Confusing, I know.
Bottom line: always read a provider’s documentation before using any metric.
3 — How professionals use xA
Scouting hidden creators — Deep‑lying playmakers, wing‑backs, even centre‑backs with a quarterback switch can rack up xA long before they register a headline‑making assist.
Process vs outcome audits — A winger on a cold assist streak but steady xA is probably getting let down by finishing, not suddenly running out of ideas.
Tactical fingerprints — Plotting xA by pitch zone highlights which channels a team repeatedly exploits.
Most importantly, xA is often paired with xAG to refine the profile of a creator. A few rules of thumb:
High xA + high xAG → elite creator who delivers plenty of dangerous final balls.
High xA, low xAG → volume distributor whose team‑mates often fail to shoot.
Low xA, high xAG → low‑touch playmaker who saves his bullets for killer passes.
Mini‑case study: the Premier League’s top 10 creators
Below are the top 10 Premier League creators for the 2024/25 season (data up to 6 May 2025). For each player you’ll see total assists, xAG, xA, minutes played, their per‑90 versions, and their ranks in terms of xA_90 and xAG_90. Data is sorted by the players’ xA_90 rank.
Don’t worry—full Python code to reproduce this table appears at the end.
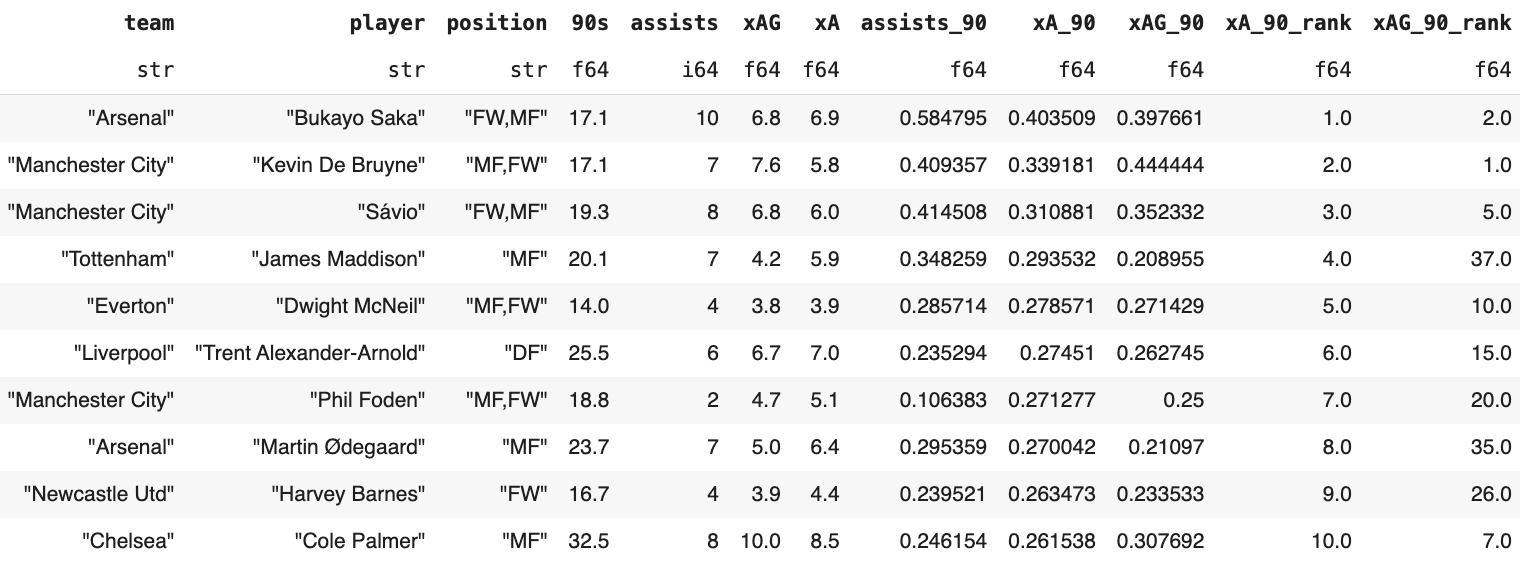
So what do we see?
Bukayo Saka (High xA + High xAG): Arsenal’s right‑sider is both busy and deadly. He supplies lots of balls into danger (highest xA) and those balls turn into big‑value shots (xAG ≈ xA). Classic elite creator.
Kevin De Bruyne (Low‑volume sniper): xAG / 90 is actually higher than his xA / 90. He doesn’t spam passes; instead he waits for the killer ball that becomes a huge chance.
Sávio (Balanced creator): Very active and the shot value is almost keeping up with the volume. A reliable supply line for City.
James Maddison (High xA, low xAG): ****Maddison keeps finding advanced receivers, but Spurs either (a) take extra touches/dribbles before shooting or (b) fail to shoot at all. The pass is dangerous in principle, but the resulting shot—if any—carries far less xG.
Dwight McNeil (Above‑average both): ****Everton’s wide creator is fairly balanced; shot quality lags volume a bit but not dramatically.
Trent Alexander‑Arnold (Volume distributor): ****Lots of probing passes (high xA), yet Liverpool’s eventual shots from those balls are middling. Typical of a high‑crossing full‑back.
Phil Foden (Volume distributor): Similar story to Trent, although from more central zones. A steady stream of chances that aren’t always huge.
Martin Ødegaard (Table‑setting 10): Like Maddison, he racks up danger in the build‑up, but Arsenal often recycle or shoot from trickier angles afterward, deflating xAG.
Harvey Barnes (Secondary creator): ****Respectable volume; the shot value lags—perhaps because many of his passes are squared across the box rather than cut‑backs.
Cole Palmer (Selective killer passes): ****The inverse of Maddison/Ødegaard: Palmer’s passes don’t flood the box (xA rank only 10th), yet when he does supply a key ball it tends to become a high‑xG shot (ranked 7th). Chelsea lean on him for the decisive action rather than general ball circulation.
Phew! I hope I haven’t lost you.
The xA / xAG combination quickly highlights under‑achievers (hello, James Maddison) and selective assassins like De Bruyne or Palmer—though you probably knew that already.
Key takeaways:
xA / xAG adds the nuance needed to spot under‑achievers.
It can help you track how a player’s creative profile evolves over time.
Most importantly, by applying the same analysis to less‑watched leagues and players, you can uncover the next global megastar. You’re welcome. 😊
And finally here’s the Python template of the day.
4 — Getting xA Data with Python
So how do we get our hands on xA data? If you’ve followed previous issues of The Python Football Review, you know the drill: Opta data freely shared on FBref.
Rather than spend hours writing your own scraper, let Pieter Robberechts’ soccerdata library handle the heavy lifting.
Before we begin, here’s a download link to the code you are about to read.
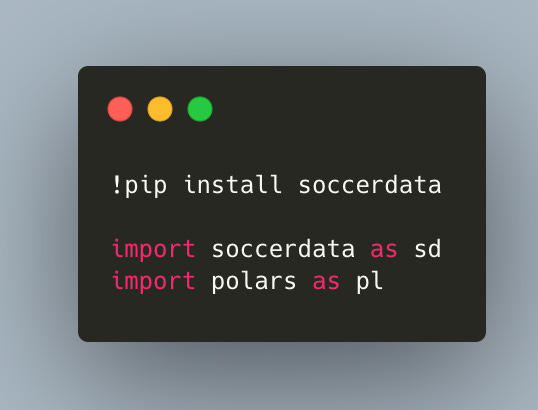
So first we install soccerdata and import it alongside Polars.
Next we define the scope of our study by specifying the 2024/25 English Premier League season from FBref. We fetch the passing stats by calling read_player_season_stats with stat_type="passing" to capture both xA and xAG.
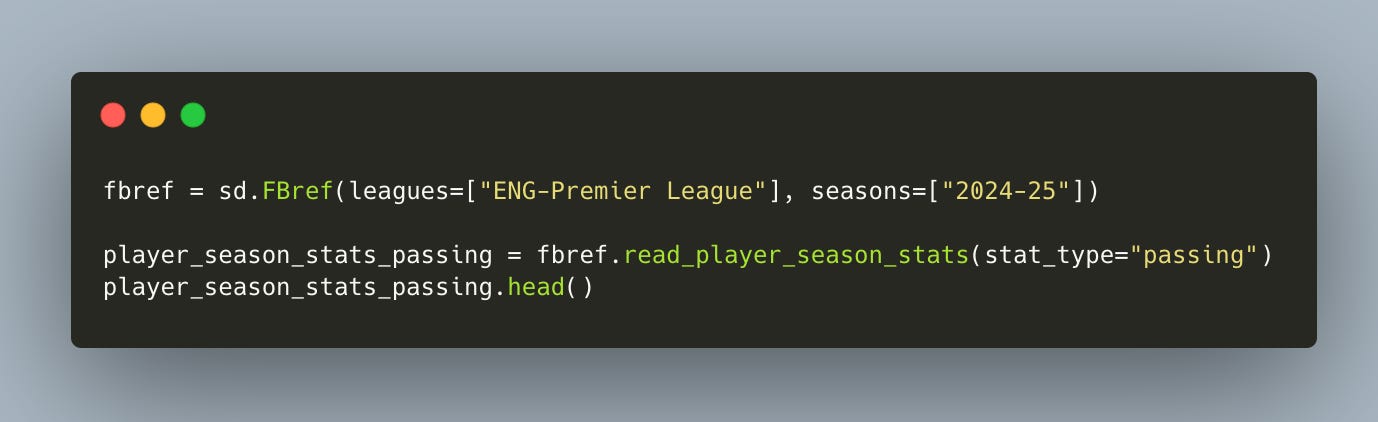
The returned DataFrame has 28 columns.
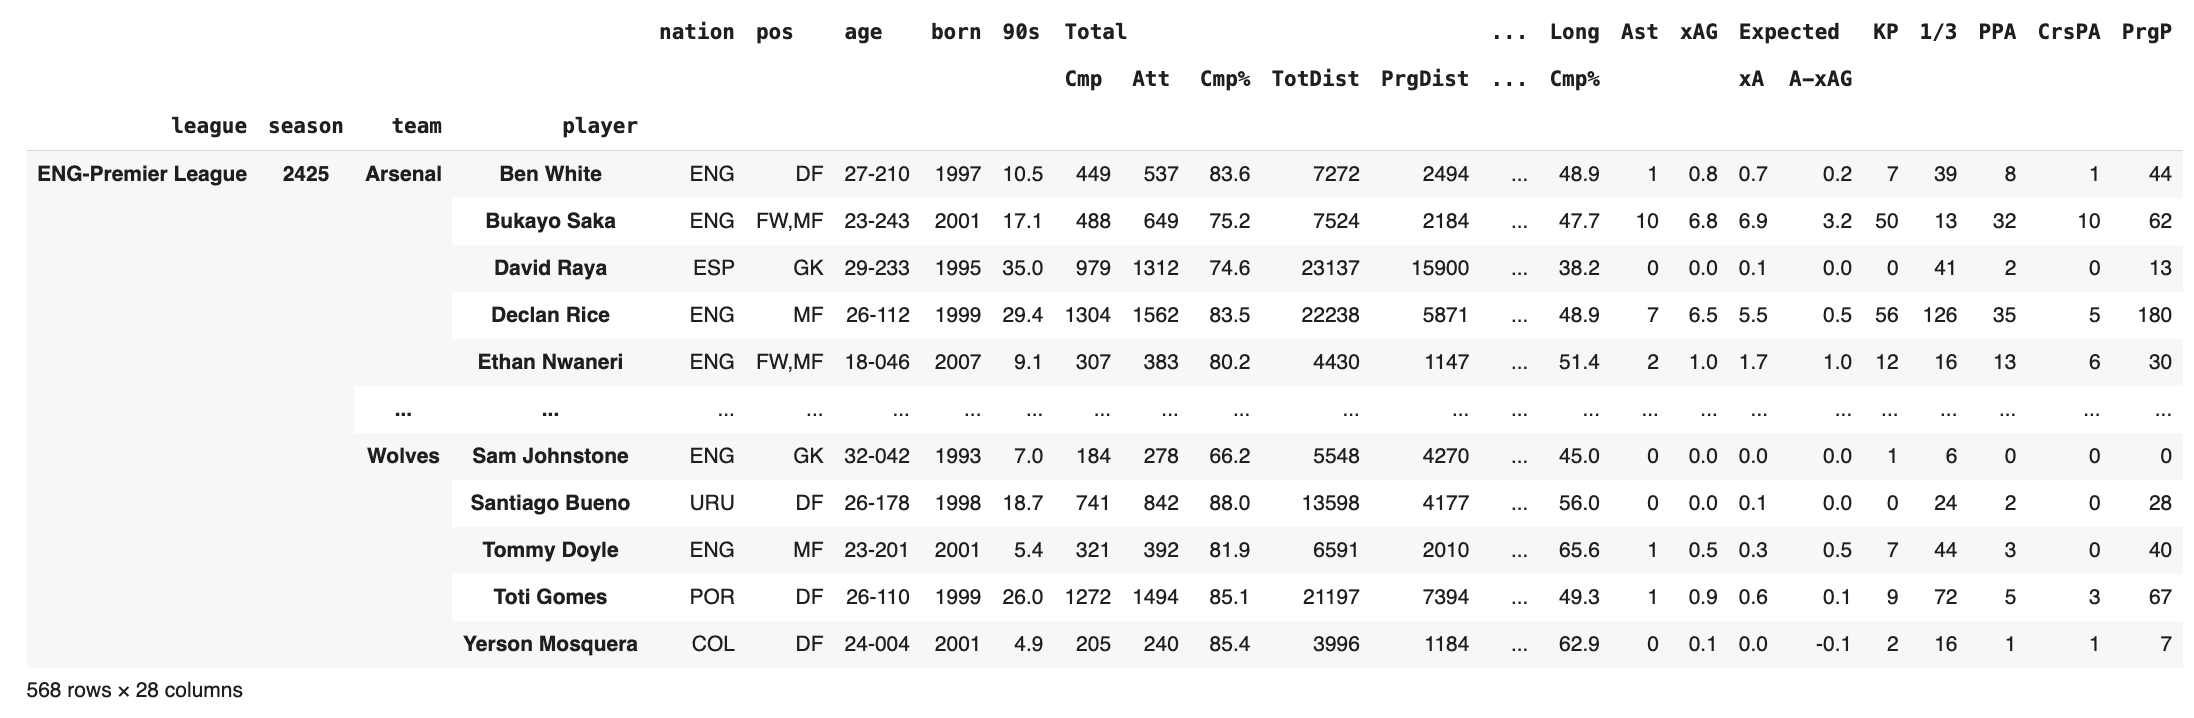
That’s why we keep only what you need—player, position, 90s, assists, xAG, and xA—then convert it to Polars for easier wrangling.
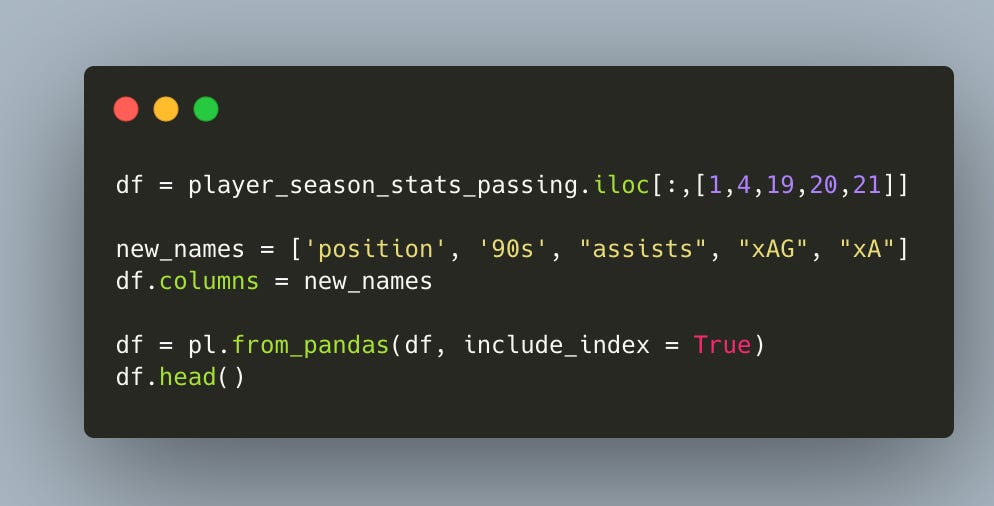
And finally we wrangle the data to
Filter out players with fewer than 10 matches.
Create the per‑90 metrics.
Rank
xA_90andxAG_90.Sort by
xA_90in descending order.
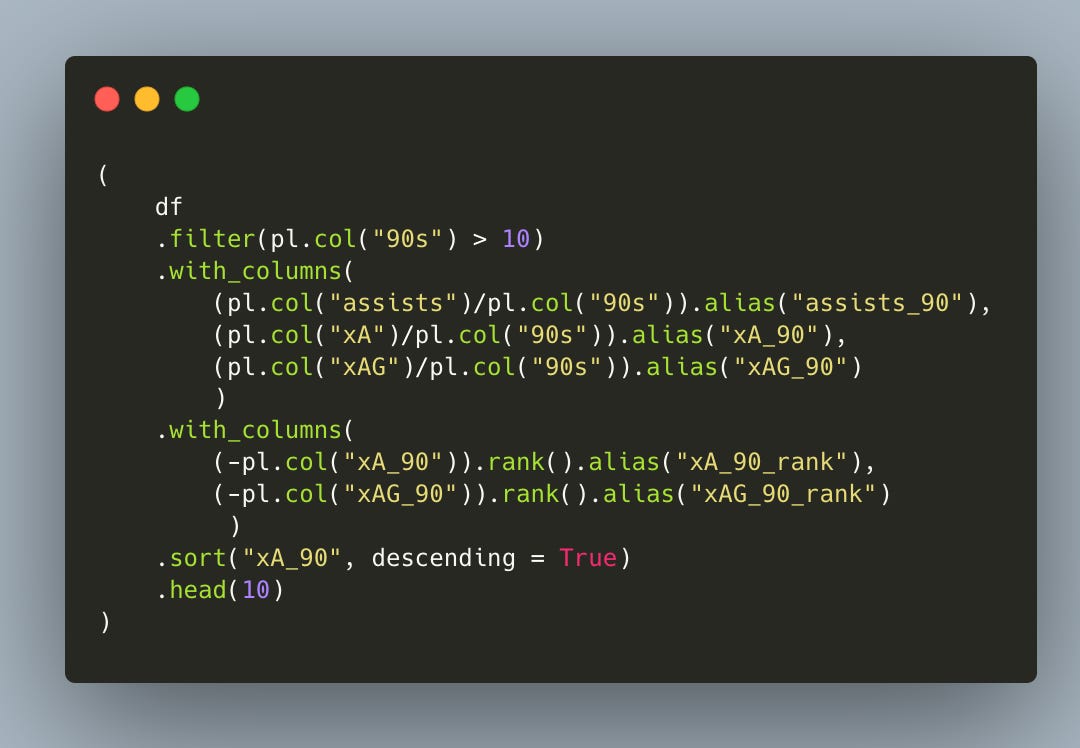
Et voilà—the table you just saw, ready for analysis.
Boom—that’s xA 101.
If you found this issue useful, please spread the word! You now know what xA is, how it’s calculated, why so many people confuse it with xAG (and why you won’t), how to uncover hidden creative talent, and—most importantly—how to pull a season’s worth of data with just a few lines of Python.
I’m still experimenting with the newsletter’s format, so your feedback is invaluable. Would you prefer shorter bites, longer deep dives, more Python, or more case-studies? Or does this mix hit the sweet spot?
My goal is to build this newsletter with you.
Until next week,
Martin
The Python Football Review
Really enjoyed these posts so far. Can’t wait for more!
Ah, just like how statisticians often mix names.