
How Wrong Are Football Pundits?
16 Years · 5,582 Lawro & Sutton Picks — What Would Your Bankroll Look Like if You’d Followed Every Single One?

Hi friend,
Welcome to The Python Football Review #009.

For as long as I’ve watched football, I’ve been fascinated by the pundits who sit in match‑day studios and announce exactly how the weekend will unfold.
But are they actually any good—or are we all just blindly trusting their reputation?
It’s time to find out.
This week I crunched every Premier League prediction that BBC (and Liverpool) legend Mark Lawrenson made between 2009/10–2021/22, along with those of his successor Chris Sutton (2022/23–2024/25), and stacked them against the market’s odds. My questions were simple:
How many matches did they call correctly?
What would your bankroll look like if you’d followed them with flat‑stake bets?
Was Lawrenson really biased against Tottenham, West Ham, and Southampton?
And—because this is the Python Football Review—I’m sharing the code at the end so that you can replicate the analysis yourself.
Enjoy!
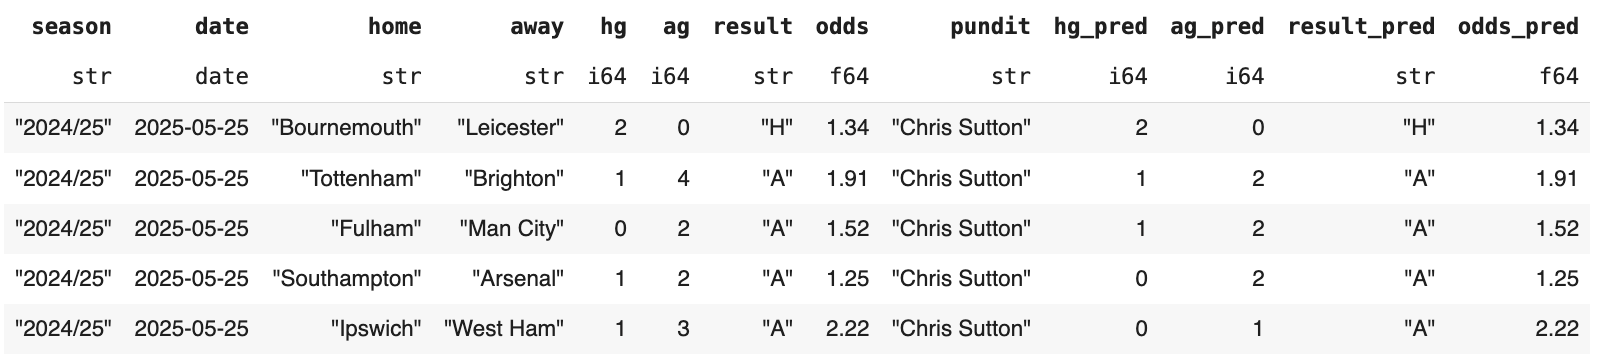
1 — The Data
I scraped MyFootballFacts for Lawrenson’s and Sutton’s predictions over 16 seasons. In theory, 16 × 380 = 6,080 games; I collected 5,582 predictions—covering 92 % of all fixtures (a few predictions were missing, nothing crucial).
Actual results and average market odds came from Football‑Data.co.uk.
For each match I have:
the pundit’s predicted scoreline and full-time forecast
the real scoreline and outcome
market‑average odds for home win, draw and away win
That’s enough to run a profit‑and‑loss simulation with a simple 1‑unit flat‑stake strategy.
2 — Simulation Results
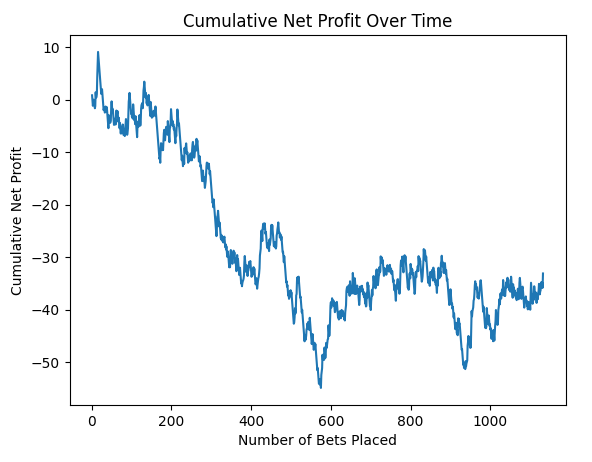
So what would have happened if we placed a single‑unit bet on all 5,582 forecasts?
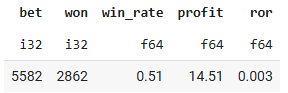
The pundits called 2,862 matches correctly (51 % win rate), resulting in a +14.5‑unit profit on a 1‑unit stake per game—an overall rate of return (ROR) of +0.3 % (14.5/5582) across the 16‑season sample.
Now that’s a surprise. Honestly, I expected a loss.
No disrespect, but making money in betting is about value, not simply picking winners, and punditry is (mostly) about predicting winners.
Having said that, a 0.3% ROR over 16 seasons is nothing to brag about. I mean the pundits were basically treading water—just about breaking even.
Nothing more, nothing less.
Individual performance
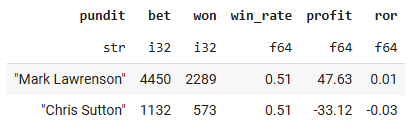
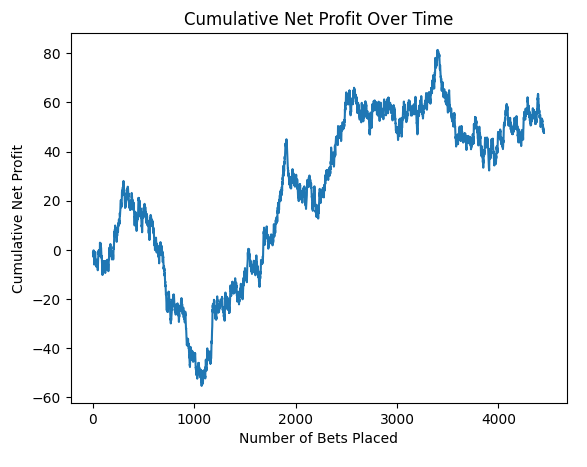
Mark Lawrenson: 4,450 forecasts → 2,289 correct predictions (51 % win rate) → +47.6 units (+1.0 % ROR). He started strong, dipped to –60 units, then clawed his way back and spent most of the time above zero.
Chris Sutton: 1,132 forecasts → 573 wins (51 % win rate) → –33 units (–3 % ROR).
Sutton hasn’t found the same luck (yet?). After 1,000 forecasts he’s 33 units down. For context, at the same stage Lawro was –60, so don’t write him off just yet.
3 — Should We Be Impressed with Lawro’s Record?
Let’s be real: a 1 % ROI over 13 seasons is nothing to brag about. You’d have earned more interest parking the cash in a half‑decent savings account.
Remember, this is after decades of insider contacts, professional playing experience, and BBC resources.
Lawro’s Predictions began as a TV segment and became a BBC Sport website staple, regularly generating hundreds of thousands of page impressions each week—peaking at 1.2 million when Rick Astley guested over Christmas 2020 (BBC).
Now, that’s a lot of interest for a 1 % return over 13 years of predictions, wouldn’t you agree?
It’s not really about betting, of course, but many fans still treat the column as a tipping service.
Any experienced bettor will tell you:
Profitable betting is about value, not just calling winners.
Blindly following tipsters (or pundits?) won’t get you far. If they’re right, odds adjust and the edge disappears; if they’re wrong, your bankroll suffers.
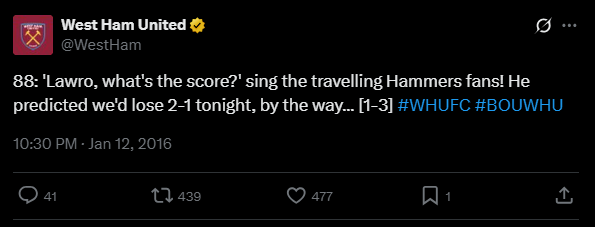
If betting were easy money, it wouldn’t be legal. Harsh but true. As Lawro himself once joked:
“If I honestly thought I could accurately predict the results of football matches, I wouldn't be here, freezing my backside off. I would be in Barbados, in Sandy Lane hotel.”
4 — Did Lawro Have Biases?
Before we get to the Python corner, let’s tackle a complaint Lawro heared a lot. Fans of Tottenham, Southampton, and especially West Ham have long claimed he’s biased against them.
So here’s a small analysis we can run: grade only Lawrenson’s for/against calls at average odds.
If his picks beat the market (i.e., show a positive ROR), you could argue his forecasts were broadly justified.
If they fail to beat the market, critics have a case that he under-performed—wilfully or not—on certain teams.
Yes, this is a simplification. A positive ROR might just reflect a few mis-priced games, while a negative one could be the product of small samples, long-shot variance, or statistically insignificant results. The goal here is insight and a bit of fun.
So how did his predictions fare for those clubs?
The table below shows the simulation results for matches involving any of those three teams in which Lawrenson picked a side (draws are excluded).
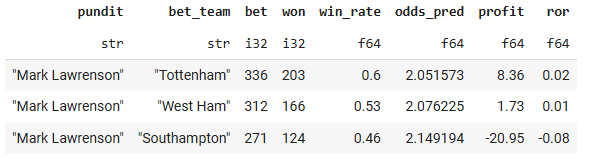
Spurs supporters can relax—Lawro was actually better than average on Tottenham fixtures, both in accuracy (60% win rate) and profit (2% ROR)
Hammers fans: his 53 % hit‑rate and +1 % ROR are almost exactly his long‑run baseline. No real bias either way.
Saints die‑hards do have a case. He undershot on Southampton, paying out only 46 % of the time and reaching a negative 8 % of returns meaning that over the long term for any 100£ wagered, you’d be expected to lose 8£.
Looking wider, the best teams in his for/against prediction portfolio were Reading (+22% ROR), Watford (20%) and Cardiff (19%).
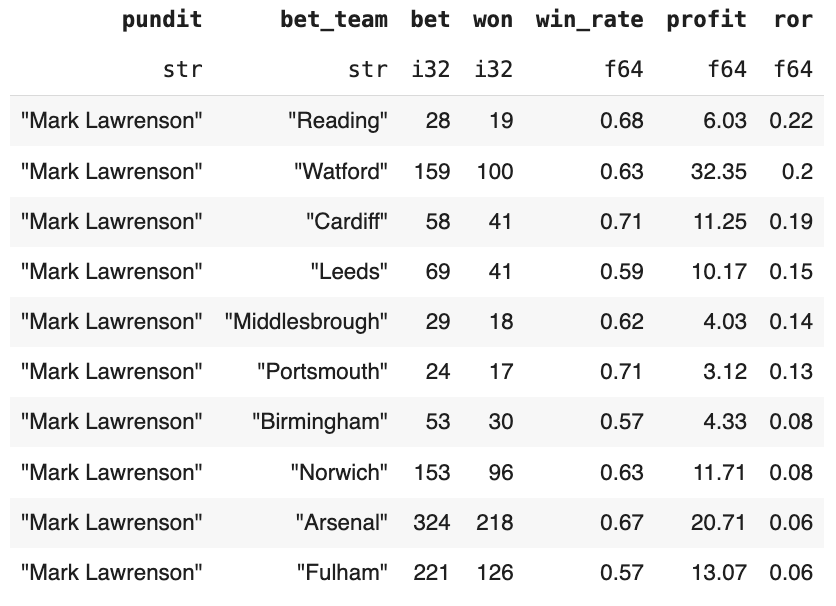
Blackpool were Lawro’s Trojan horse: only 43 % win rate and a –31 % ROR, followed by Brighton (-16%) and Wigan (-14%).
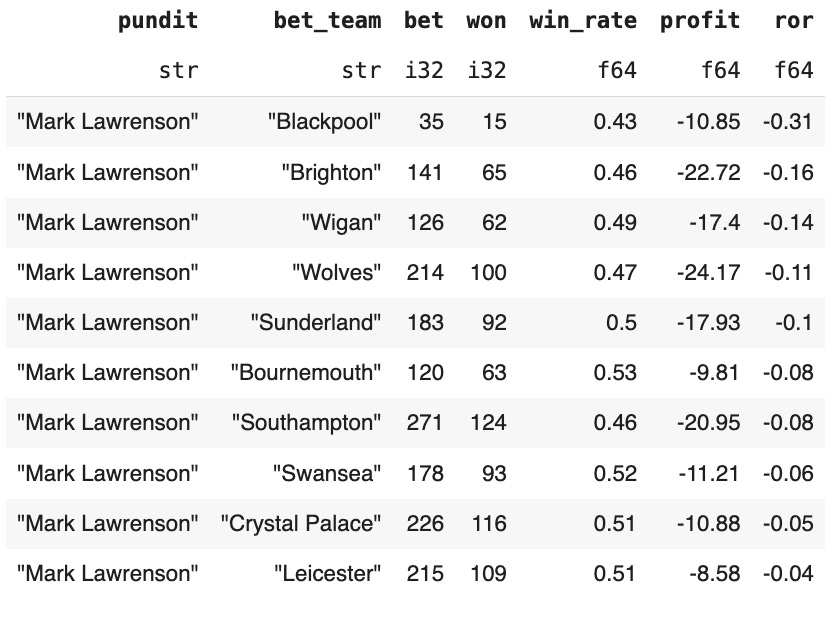
Bottom line: the “Lawro hates my team” meme is mostly myth—unless you’re a Southampton fan. (And even then, there are five clubs he performed worse against).
5 — The Code
Finally, here’s the Python notebook so you can replicate the analysis yourself.
About 80 % of the work went into scraping the data; I’ll spare you that mess so you can jump straight into the clean, analysis‑ready dataset and do some wrangling. You’re welcome. (We’ll tackle web‑scraping another day.)
If you’re new to Python, a Gmail account is all you need: open a Google Colab session, import the notebook you just downloaded, and run the cells in order. At the second cell you’ll be prompted to upload the data file—select the one you grabbed from the link above—then continue executing cell by cell.
The notebook loads the pre-cleaned data and walks through every step needed to produce the simulation tables.
Credits: Predictions from MyFootballFacts and results/odds from Football‑Data.co.uk (maintained by Joseph Buchdahl).
Boom—that was football pundits uncovered.
If you enjoyed this edition, please share it with a friend.
You now know how accurate football pundits really are, why their tips deserve a pinch of salt, and how to wrangle a dataset to test a pundit’s track record.
Thanks for reading—see you next Thursday!
Martin
The Python Football Review
P.S. Did the results surprise you? Reply below or drop your favourite pundit cliché and I’ll test it in a future issue.
Great work! I interviewed Lawro six years ago and this was his explanation for his predictions:
‘The system is very much, in capital letters, random. All I ever do, I read the paper at the weekend and I look at all the leagues, so I can tell you where most teams are in most leagues. It’s something I’ve always done.
But predictions wise, I do it on a Thursday morning. There’s my league table on there and the real one, I don’t even look at them. I’ll just remember Leicester winning last weekend or whatever, work out who they’re playing against, and just guess.’
Very interesting stuff, thank you. Didn’t know you can become one of these professionally in the UK.
I’m not sure whether the cummulative net profit line chart is chronological. If yes, i’m surprised Lawrenson’s credibility recovered after the initial dip.