
Football Data Wrangling (in plain English)
Why 80 % of data science is about wrangling—and the Python shortcut that makes it painless

Hi friend,
Welcome to The Python Football Review #011.
Seasoned analysts will tell you that 80 % of any football data project is spent on one thing: wrangling. If the term is new to you, think of it as the combined art of cleaning and transforming raw tables so your analysis doesn’t fall apart later.
In this issue you’ll learn:
what data wrangling really means,
why even “clean” datasets still trip people up,
the common bottlenecks that beginners face, and
the one Python library that makes wrangling faster—and far less painful.
Enjoy!
Before we dive in — quick heads-up.
I’m working on a Fast-Track Guide to Football Analytics with Python — designed to cut through the usual beginner roadblocks and get you hands-on, fast.
It’s packed with ready-to-use templates and practical case studies, so you can skip the fluff and start exploring football data with confidence.
Interested? Join the waitlist below:
Okay, let’s dive in.
1 – Cleaning
Last week, you learned the four ways to collect football data. If you missed that issue, you can catch up here. Once you’ve collected the data, your next move is to clean it.
But wait, Martin—isn’t the data I just downloaded already clean?
It’s tempting to think so. If your feed comes from an internal pipeline, a paid JSON API, or a trusted public hub like FBref, the tables usually look pristine. Yet they almost always hide little traps:
A handful of xG values are missing—models choke on blank rows.
Brighton appear as “Brighton”, “Brighton & Hove Albion” and “BHAFC” across seasons. Pick one or your merges will explode.
Dates sneak in as plain text; numeric columns arrive as strings. Try plotting those and see what happens.
Long story short: “collected” does not equal “analysis‑ready.” The safest mindset is to assume every dataset is dirty until proven clean.
Once you’ve fixed the nulls, unified names, and straightened data types, you can move on to the fun part: transforming.
2 – Transforming
Cleaning makes the data safe; transforming makes it useful.
Here’s what usually happens in this stage:
Zoom in – Slice the universe down to what matters: maybe just Premier League matches since 2014/15, or only Arsenal home fixtures, or every shot taken after the 75‑minute mark.
Create new metrics – Raw columns rarely answer football questions on their own. You might turn
xGandminutesinto xG per 90 min, combine passes into a possession percentage, or compute contributions as goals plus assists.Summarise up a level – Event data might be often too granular for the question you’re asking. Aggregate it until each row matches the decision-making level you care about: turn individual shots into total xG per match or combine match records into team-season aggregates.
Reshape the table – Statistical models prefer “one row = one observation.” That could mean pivoting long (each team a separate row). A graph may require « one column = one observation » and that could mean pivoting wide (each team in its own column). Switching formats is routine.
Stitch multiple sources together – Want to add betting odds or other non-performance data? You’ll merge tables on date, match ID, or team name; uniform naming from the cleaning step is what keeps these joins from exploding.
Scale where needed – Some algorithms behave better when inputs sit on a common scale. Simple min‑max scaling is often enough.
A single project may loop through these tasks several times: aggregate, spot an outlier, go back, filter differently, aggregate again. The end‑product is one tidy, logically structured DataFrame you can feed straight into a model or visual.
The goal is simple: produce a single, well‑structured DataFrame your model, chart, or dashboard can consume without complaint.
Cleaning + transforming = wrangling—and that’s where 80 % of real project time goes.
Told you it was important.
3 – How do you actually wrangle data in Python?
For years the default answer was pandas.
Pandas gives Python a DataFrame object (Python itself has none), and every tutorial on Earth seems to start with import pandas as pd.
But here’s the trouble: the API is showing its age.
You juggle as_index=False, fight the dreaded SettingWithCopyWarning, and chain methods that read nothing like plain English. Great library—just (dare I say it) not beginner‑friendly.
A newer option, polars, fixes all three pain‑points:
Faster – Under the hood it’s Rust, so large tables fly.
Cleaner syntax – Verbs like
select,filter,with_columnsread like a recipe.Short learning curve – Fewer edge‑case arguments, no copy‑view headaches.
If someone offered you standard vs. faster, clearer, easier to remember, which would you pick?
Exactly.
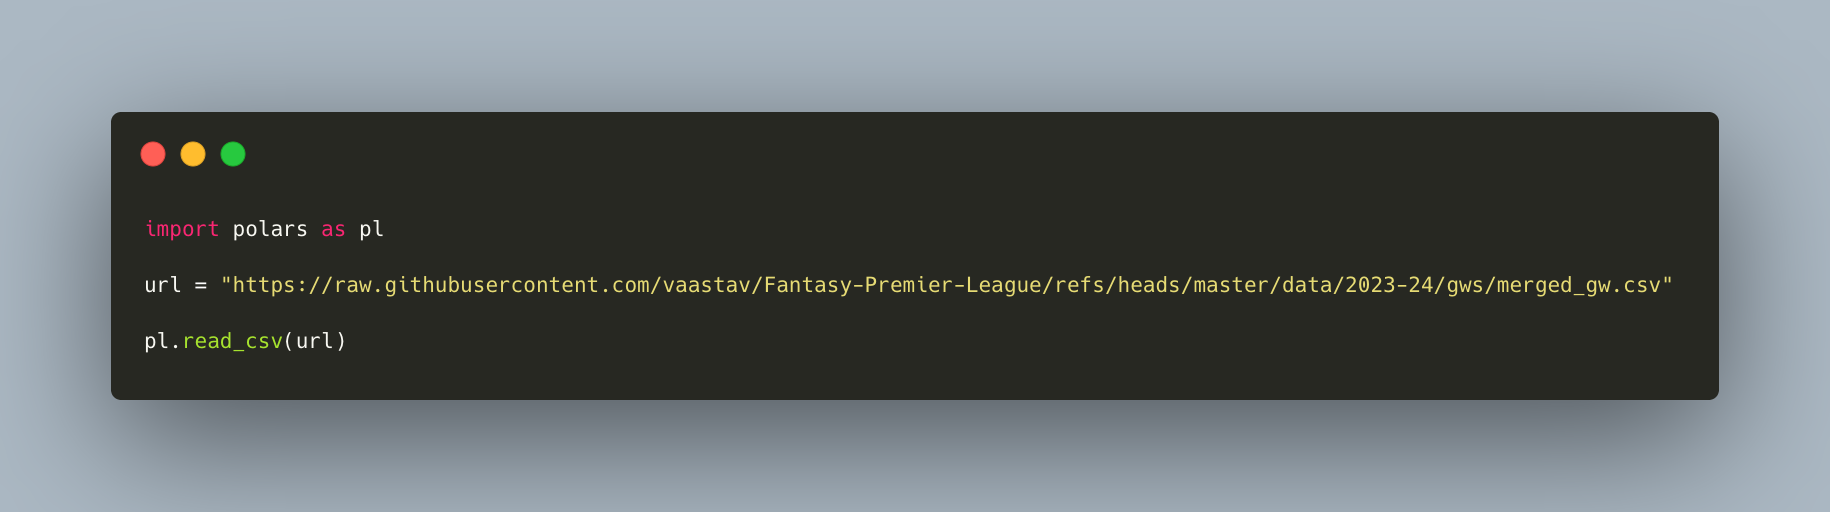
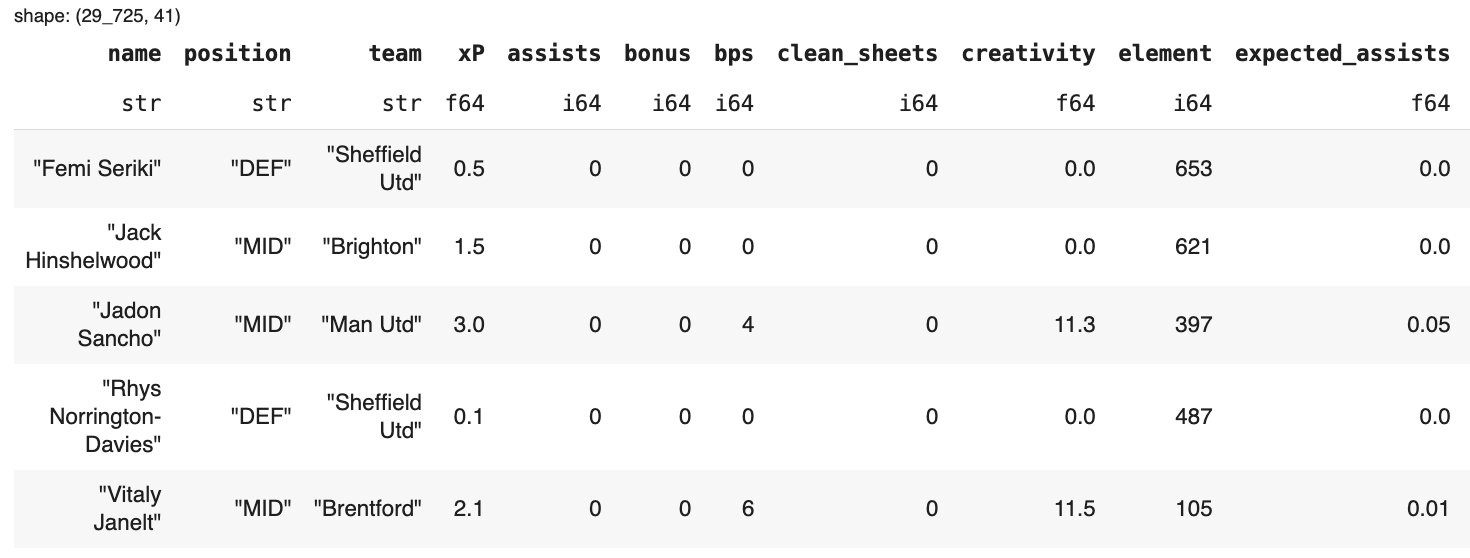
Here’s a sample Polars code. For this exercise, we’ll use a 2023/24 Fantasy Premier League dataset available on Github that contains ~ 30,000 rows, where each row records a single player’s stats for one Premier League gameweek. The data contains 41 columns covering everything from goals and assists to minutes played, xG, xA, and more.
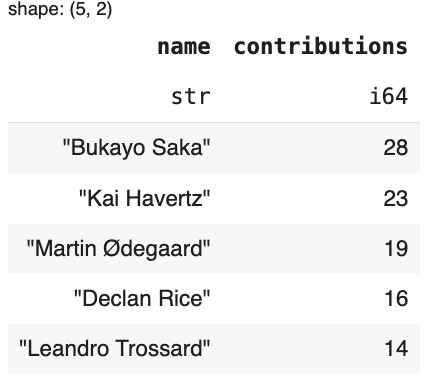
If we want to wrangle the data to discover Arsenal’s top contributors in goals and assists, here’s how we could do it with Polars:
A quick Polars demo
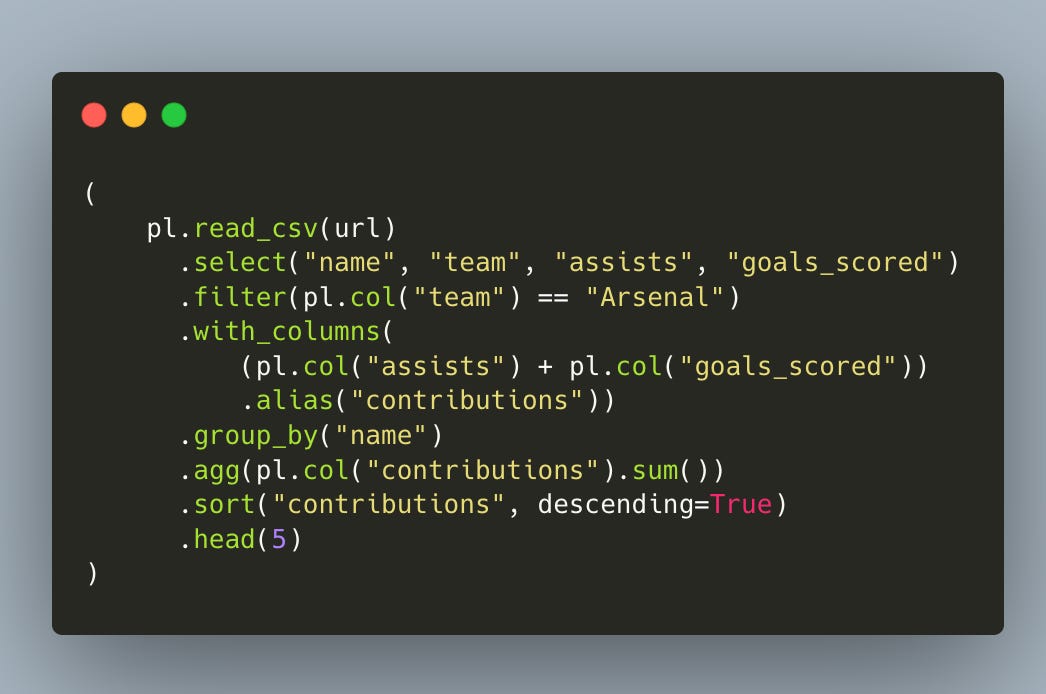
Try reading that line by line:
read_csv– load the file (using its URL).select– keep only the columns we need.filter– keep only the Arsenal rows only.with_columns– addassists + goals_scoredas contributions.group_by/agg– group by each player and aggregate his total contributions.sort– rank the players by their contributions and show the top five.head- show the top 5 performers.
That’s the entire story—no temporary variables, no lambdas, no warnings. Swap select for merge or pivot and you’ve covered 80 % of day‑to‑day wrangling.
The point of this demo is to show that Polars reads like a recipe (it has tons of other advantages but that’s a story for another time). Even if you’ve never written a line of Python in your life, you’ll have no trouble following it. Better still, once you type it out, the syntax sticks—because you use clear, verb-style commands.
Next time you need to wrangle data, the steps will come right back to you, streamlining your workflow like nothing else. Speaking from experience here.
Now, polars won’t make every wrinkle disappear, but it removes a lot of the boilerplate that trips newcomers. Learn a dozen verbs and you’ll slice through datasets while everyone else is still Googling “Pandas groupby keeps index true/false?”
(And yes, Pandas is still the industry standard; we’ll look at bridging the two in a future issue.)
4 – Rules of thumb from a decade in data consulting
Choose a library you can walk away from and still remember.
If you might take a few weeks off, Polars’ verb‑style API is far easier to pick up again than Pandas’ bracket soup.
Assume every dataset is messy.
Even “premium” feeds hide quirks—extra spaces in names, dashes instead of
NaN, silent duplicates. Treat cleanliness as a hypothesis you must test, not a fact.Verify first, trust later.
Quick descriptive stats (min, max, unique counts) expose impossible values before they poison your model.
Name things clearly and consistently.
Lower‑case, snake_case, no spaces:
team_id,match_date,xg_total. Future‑you—and your join keys—will thank you.Interrogate every column.
A header can lie. Ask “What exactly does possession mean here?” before you publish a chart based on it.
Debug on a snack‑size sample.
Pivot won’t run on 100 k rows? Slice ten rows, fix the issue, then scale back up. Small chunks reveal problems fast.
Stick to these habits and wrangling becomes routine rather than a recurring nightmare.
Boom—that’s data wrangling in plain English for absolute beginners.
If this issue helped, feel free to pass it on. You now understand why most people stall at the wrangling stage—and how to jump ahead of 90 % of them.
I’m still tweaking the format, so hit reply and tell me what you’d like more (or less) of: shorter bites, deeper dives, extra Python snippets, or broader football concepts?
My goal is to build this newsletter with you, not just for you.
See you next Thursday,
Martin
The Python Football Review
Good stuff, Martin! Will absolutely give Polars a try. The logic reminds me a bit about SQL language actually. Looks perfect if you know what you want to analyze from the get go. Would love to see more advanced examples with Polars - for example building a player ranking or percentiles calculations that makes up a radar chart 💯 Maybe something we could look into together?
Yep I'm with Martin on that comment about Polar looking nicer! I'm on a learning journey now of working through Data camp exercises and it's all about pandas... I think this post length is just right too. Combining two of my favourite things, data and Arsenal! Do you know if there are equivalent datasets for Arsenal Women?