
5 Mistakes Beginners Make When Learning Python for Football (and How to Solve Them)

Hi friend,
Welcome to The Python Football Review #014.
Today, we’re tackling a question I’ve been thinking about a lot lately: What are the biggest mistakes beginners make when they start learning Python for football?
The idea came while I was working on my Fast-Track Guide to Learning Python for Football. Like most of my projects, it took twice as long as planned — but the good news is, the guide is now live (you can grab it below).
Before you do, let’s dive into the 5 biggest mistakes beginners make — and how to solve them.

Mistake #1 — Starting without a roadmap
Python is everywhere — websites, apps, machine learning, and of course, football analytics. The good news: there are thousands of tutorials. The bad news: that’s the problem.
You search online and you’re hit with two extremes: a 5-hour Python bootcamps made for software engineers or overly technical research papers / GitHub projects written by data scientists for other data scientists. And on rare occasions, you’ll find a single video showing one cool football visualisation or model — but nothing structured, nothing that takes you from start to finish.
Both are valuable. Neither are designed for a beginner who just wants to answer a simple football question like:
“How many points is my team projected to win based on their current form?”
So you bounce from tutorial to tutorial, learning random bits of Python without ever completing a project. The overwhelm quickly turns into paralysis:
“Am I supposed to learn all of Python before I start analysing football?”
No.
In the beginning, you don’t need all of Python — you need the minimum viable skills that let you move through the four phases of a project: Collect —> Wrangle —> Visualise —> Model.
Just enough to complete something real — fast.
Once you understand the framework and have a tiny toolkit for each phase, you stop wandering and start building. And that brings us to the next mistakes — one per phase — starting with:
Mistake #2 — Getting stuck at data collection
Few things derail a beginner faster than getting stuck at step one — finding usable data.
Many YouTube tutorials gloss over this stage because collecting data can be a pain, but in real projects you have to source it yourself. The bottleneck usually looks like one of two things:
you lose days trying to build scrapers (often with ChatGPT’s help), or
you simply don’t know where to find analysis-ready data.
So you copy someone’s code… and it breaks. Now you’re left wondering: Did the website change? Is my environment broken? Did the site upgrade its bot protection?
You have no idea where the problem is, and the frustration kills your momentum.
The easier path — especially when starting out — is to use reliable shortcuts. In football analytics, those shortcuts are community-built wrappers like soccerdata and scraperfc.
These packages exist because people in the analytics community created them so you don’t have to build scrapers yourself. They let you load team, match, and event data across multiple leagues in minutes, using simple one-liners.
Spend your time analysing football — not fighting HTML (at least not in the beginning).
Mistake #3 — Letting pandas slow you down
You’ve finally collected your football data. Naturally, you want to jump straight to the fun part — plotting visuals, building models, proving your point.
Not so fast.
In real projects, the bottleneck isn’t the chart or the model. It’s getting your data into a shape where those things even work.
That stage is called wrangling — cleaning, transforming, structuring — and seasoned analysts joke that it eats 80% of every project. It’s funny only because it’s true.
Sure, some paid feeds or public repos give you neat, tidy tables. But the moment you combine sources or scrape data yourself, chaos appears: missing values, inconsistent team names, wrong data types, tables shaped like abstract art.
Every tiny issue compounds. This is where frustration spikes.
For years, the default tool was pandas — every tutorial on Earth seemed to start with: import pandas as pd.
And soon you’re staring at code like:
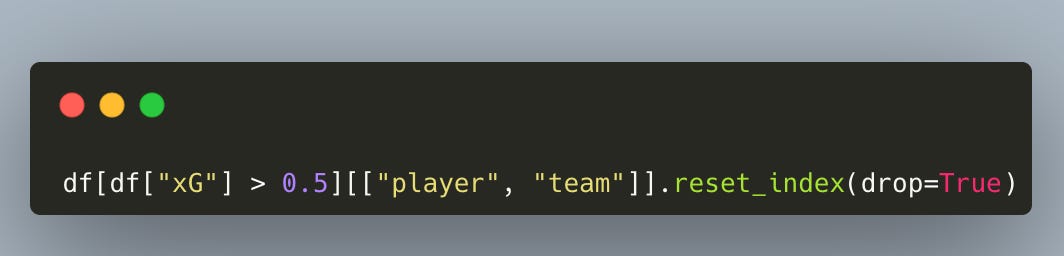
And thinking: “How am I supposed to remember this?” Welcome to pandas bracket soup.
The Fix? Use Polars – a modern, readable and fast library. Instead of nested brackets and constant index resets, Polars reads like plain English:
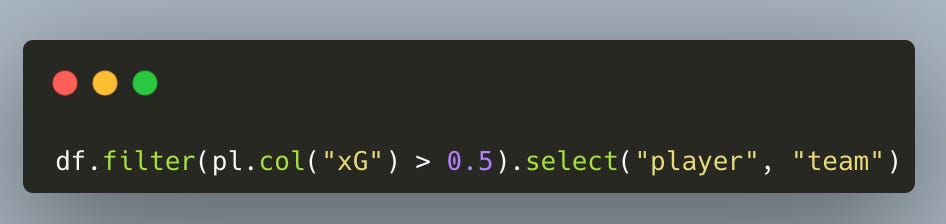
If your wrangling code is readable, you learn faster.
Instead of wrestling with syntax, you stay focused on the football question.
Mistake #4 — Jumping into advanced visuals without mastering the basics
You’ve collected your data. You’ve wrangled it into shape. Now comes the part that feels the most rewarding: turning numbers into visuals.
But this is where many beginners hit a wall.
You search GitHub, find someone’s beautiful shot map or radar chart, copy the template … and then spend two hours tweaking fonts, colours, and layout. You’re focussed on styling instead of learning fundamentals.
The real bottleneck isn’t Python syntax. Most visuals take just a few lines of code. The bottleneck is not knowing what to plot, or why. “Is this a scatter? A bar? A line? A radar?” So you jump into advanced football charts without first learning the basics.
Here’s the thing nobody explains: A shot map is just a scatter plot on a pitch. An xG flow is just a line chart over time. A radar is just a bar chart, arranged differently.
If you understand the fundamentals (scatter, line, bar etc.) — you can build the football-specific visuals later with (greater) confidence.
So focus on the fundamentals first, templates later.
Start with Matplotlib to learn the core chart types and how to shape data for them. Then add mplsoccer to place those charts on a football pitch when you’re ready.
Mistake #5 — Treating modelling like black-box magic
You’ve gathered your data, wrangled the mess, and even sketched a few charts. Now every football guru on Twitter is going to ask, “Great—so what does this mean for the next match? The next season? The next transfer?”.
Welcome to data modelling: the stage where history turns into actionable predictions … and the stage every beginner thinks is the whole show.
Newcomers often picture this step as black-box AI magic—machine learning this, neural networks that. In reality, most useful models boil down to a few clear ideas and a single line of code that does the heavy lifting. The hard part isn’t running a model; it’s framing the question, choosing the right tool, and interpreting results without fooling yourself.
The biggest trap beginners fall into is jumping straight to complex algorithms without understanding the mechanics or the “why” behind them.
The truth is, if you focus on just one algorithm per key machine learning task, you’ll cover 80% of what you’ll ever need.
In practice, that means mastering:
Two supervised algorithms — Linear Regression (for predictions) and Logistic Regression (for classifications).
Two unsupervised algorithms — K-Means Clustering (for grouping) and PCA (for dimensionality reduction).
Those four alone will prepare you for the vast majority of real-world problems you’ll face. Once you understand the mechanics — how to run them, how to read results, and how to apply them — then you can move on to the fancier stuff like ensemble models or XGBoost.
With scikit-learn, most of these take a single line of code. The real work lies in framing the question and interpreting the output.
And speaking from experience — you’d be surprised how often, even in the business world, a simple linear regression delivers great results.
Just remember: simple is smooth, and smooth is fast.
You don’t need neural networks to start. You need a question → a simple model → an insight.
Boom — those were the 5 biggest traps beginners fall into when learning Python for football.
To save you months of piecing things together, I built a Fast-Track Guide that tackles each one of them — one phase at a time.
Grab it before November 9 to receive the Top-Down Python Betting Blueprint for free — and before the price of the guide increases.
Thanks for reading,
Martin